- DATE:
- AUTHOR:
- S&P Global
September 2026 S&P Capital IQ Pro Preliminary Release Notes
S&P Capital IQ Pro Release Highlights
In this release, we added new datasets and tools on Capital IQ Pro, designed to enhance our clients' daily workflows:
Enhanced ChatIQ & New GenAI Tools: The enhanced ChatIQ, our GenAI-powered research assistant, now delivers instant, multi-source analysis of S&P Global’s industry-leading data through a single conversational experience. We also introduced a GenAI-powered Excel modeling assistant for streamlined analysis in Excel, and ChatIQ Presentations in Labs for seamless creation of data-driven PowerPoint slides with trusted insights.
DCF Valuation: Discounted Cash Flow (DCF) analysis is now available on the Valuation page, enabling more comprehensive company assessments based on projected cash flows.
Private Markets: A new custom private markets benchmarking tool enables users to build tailored benchmarks and compare fund performance using key metrics, enhancing peer benchmarking and improving decision-making.
Fixed Income: Markit’s Global Sector Curves are now integrated into S&P Capital IQ Pro, providing deeper insights into global bond markets with extensive curve coverage, and introducing a new Rate Profile page for visualizing trends.
RatingsDirect & Credit Memo Builder: RatingsDirect Corporate and Sector Profiles are redesigned for faster, customizable access and expanded Insurance analytics. Credit Memo Builder now features improved content quality, source transparency, Quality Scores Beta, and more flexible templates, supporting more consistent, efficient credit analysis.
ChatIQ
In this release, we introduced significant enhancements to ChatIQ, Capital IQ Pro's GenAI-powered research assistant, purpose-built for financial professionals who need to move faster from question to insight.
ChatIQ
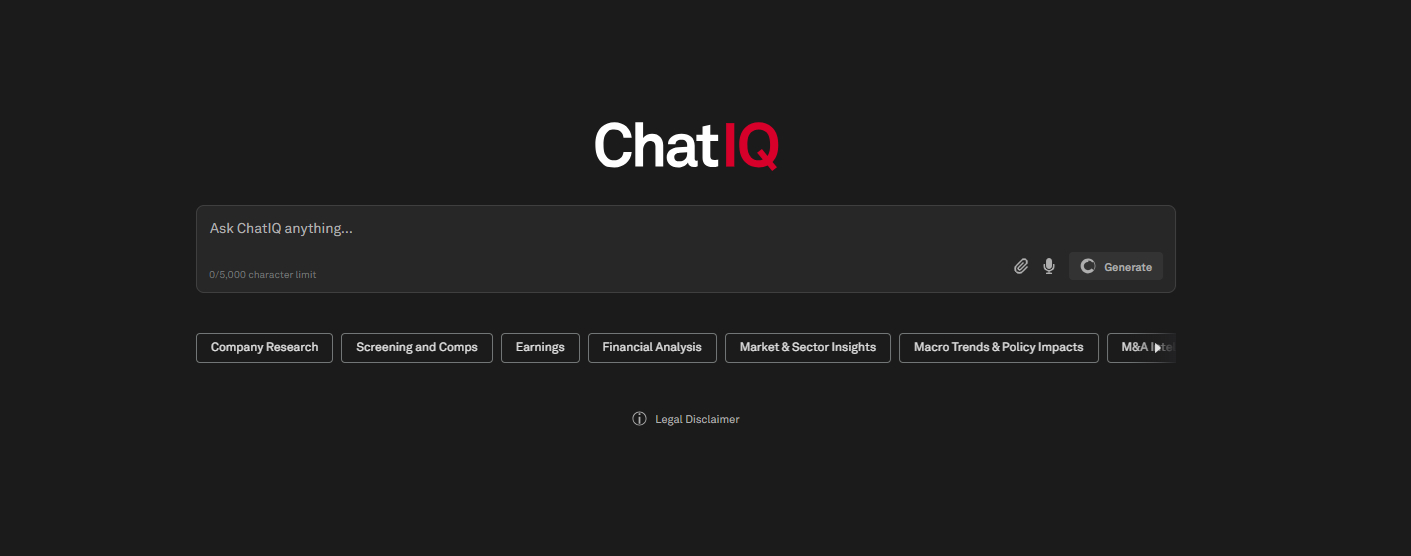
Users can now access the new ChatIQ, which eliminates the friction of traditional data navigation and puts sophisticated, multi-source analysis at their fingertips. Available on both desktop and mobile, ChatIQ redefines how financial research is done by delivering the depth and breadth of S&P Global's industry-leading data through a single, conversational experience, combined with screening and charting capabilities, and with access to a variety of content sets to provide more comprehensive and auditable responses.
Find it in the platform:
Navigate to ChatIQ in the top navigation
Ask ChatIQ anything from the most basic questions to complex analyses
Content Sets in ChatIQ
Equity Pricing | Peers & Lists |
Index Pricing | M&A Transactions |
CDS Pricing | Macroeconomic Data |
Trailing & Forward Multiples | Credit Ratings |
S&P Capital IQ Estimates | Equity Ownership |
Visible Alpha Standardized Estimates* | Filings |
S&P Capital IQ Financials | Transcripts |
SNL Bank Financials* | MI News & Research |
SNL US Bank Regulatory Financials* | S&P Global Energy News |
Depository Rates | With Intelligence Mandates and Strategies |
Rates & Yields |
|
*SNL Financials: Represents the 106 most commonly used data items
*Visible Alpha Estimates: Access to Visible Alpha Estimates data needs an additional subscription. Please contact your account team for details
Example Prompts:
SNL Financial
What are the total loan and lease charge-offs for Wells Fargo over the last 3 years, and how does that compare to peers?
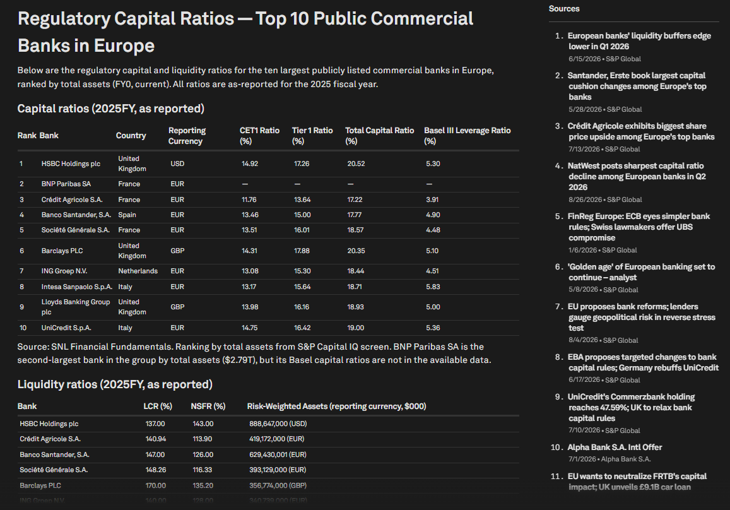
Provide regulatory capital ratios and outlook for the top ten public commercial banks in Europe
Depository Rates
What are the 12-month CD rates for the top ten banks by LTM deposit growth in Florida?
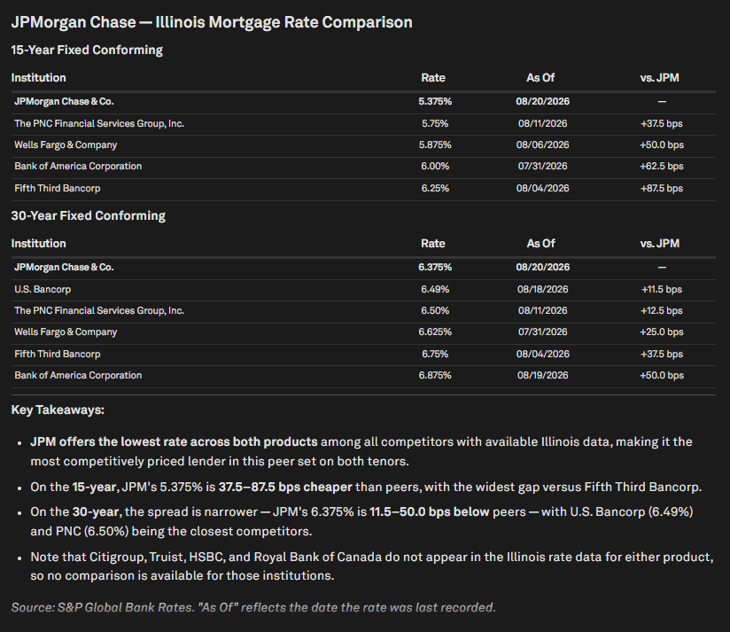
Compare JPM's 15-year and 30-year mortgage rates to their competitors in Illinois
S&P Global Market Intelligence News & Research
Summarize recent news on NVIDIA’s investments in AI-related products
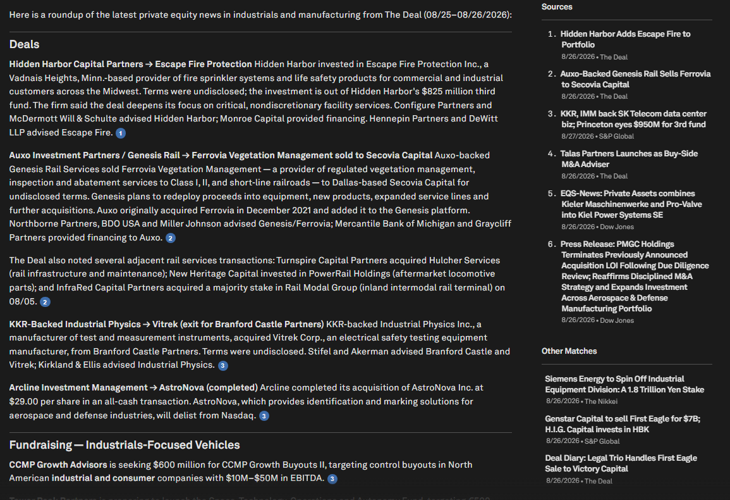
Round up the latest private equity news in manufacturing and industrials from The Deal
S&P Global Energy News & Research
How has the conflict in Iran affected agricultural commodities?
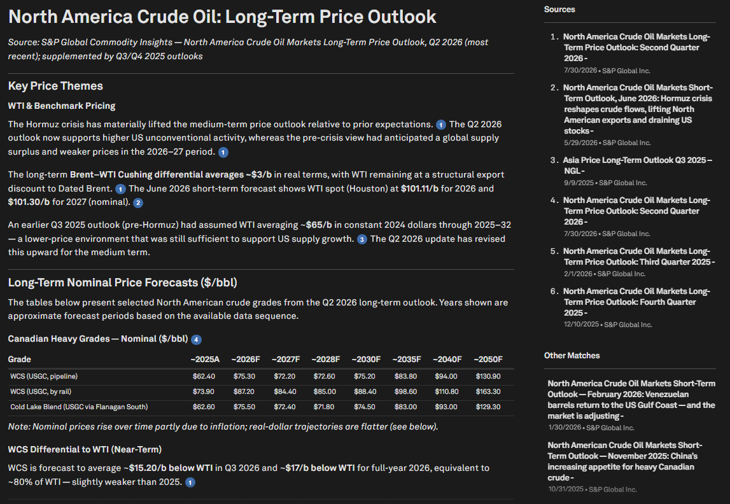
What is the long-term price outlook for North American crude oil?
Filings
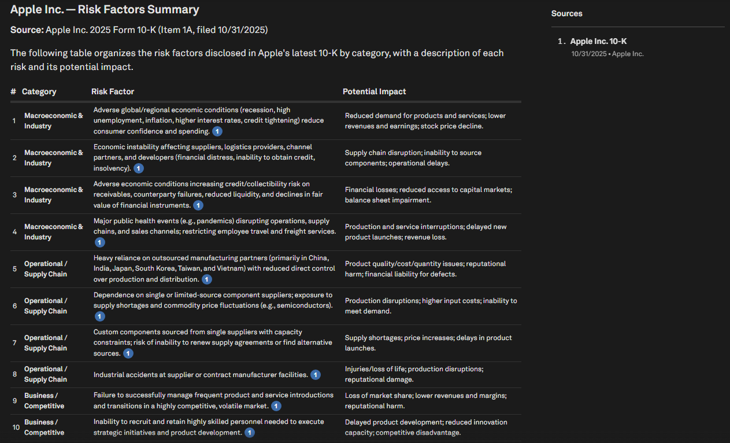
Using the latest filings as the source, what are the risk factors facing Apple? Present the points in a table with the risk noted and categorized by the impact of the risk
Using the latest Tesla proxy statements, summarize Elon Musk's compensation package with a focus on equity-based awards
Transcripts and Investor Presentations
Using NVIDIA's latest earnings call, outline management outlook and guidance on key metrics. Provide a table of key financial metrics and guidance with a summary of the company outlook
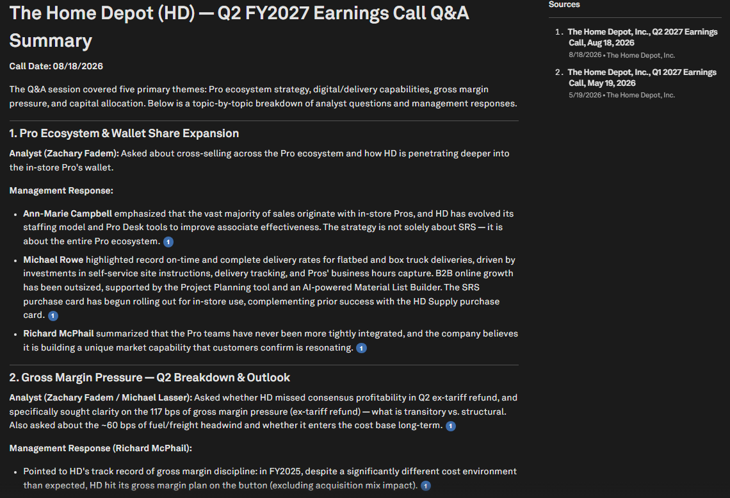
Summarize the key topics discussed during the Q&A portion of HD's last earnings call and outline company management responses
Visible Alpha
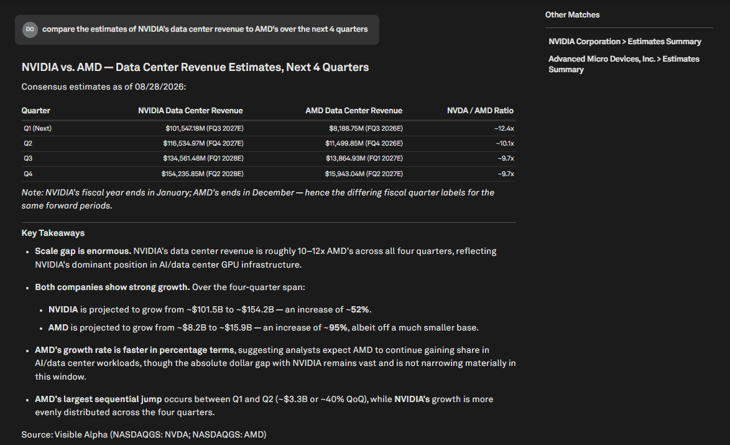
Compare estimated datacenter revenue for NVIDIA and AMD for FY2026 and FY2027
Show estimated RevPAR, occupancy, and average daily rate for Marriott, Hilton, and Hyatt for FY2026
S&P Capital IQ Estimates
What are consensus revenue and EPS estimates for ASML for FY2026 and FY2027, in US dollars?
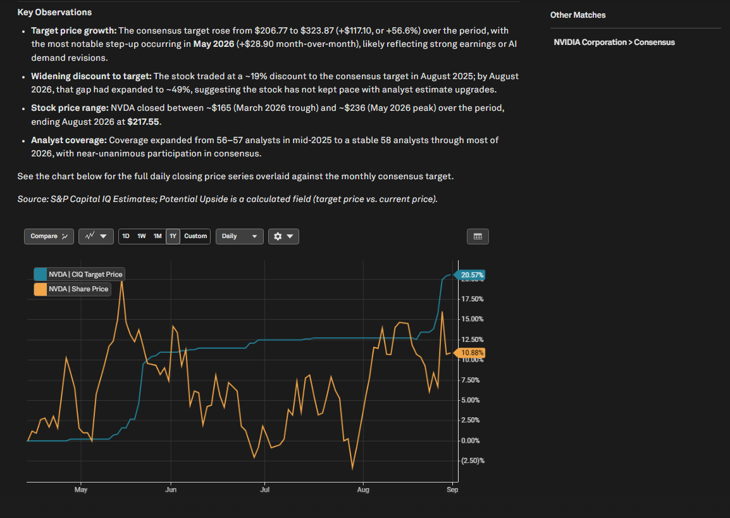
What is Nvidia's current target price, and how has it changed over the past 12 months?
S&P Capital IQ Financials
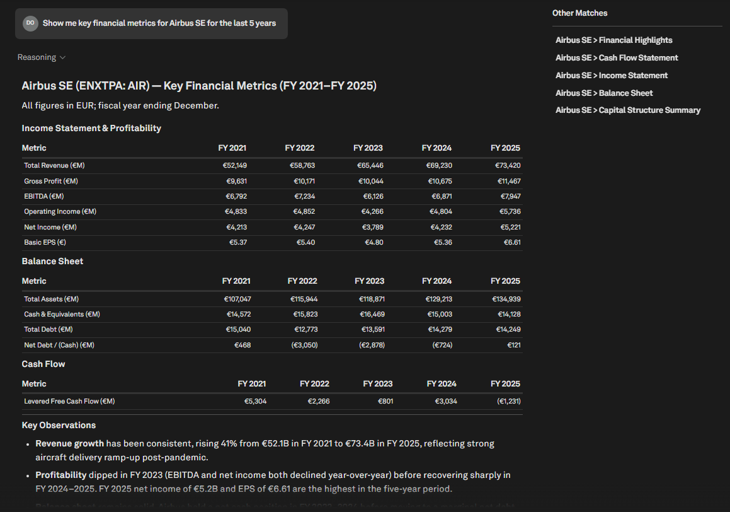
Show me key financial metrics for Airbus SE for the last 5 years
Compare total revenue and operating income for Nike, Adidas, and Lululemon for FY2024 and FY2025 in US dollars
Market Data & Trailing and Forward Valuation Multiples
Build a peer comp table with current P/E, P/B, and P/TBV for HSBC and its European bank peers
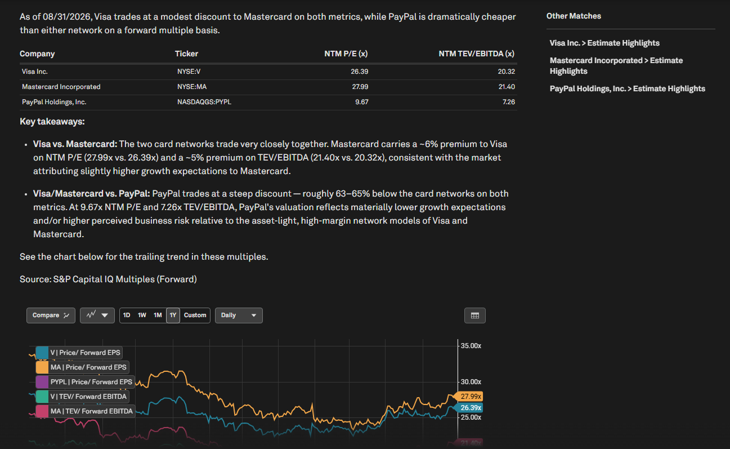
How do Visa's NTM P/E and TEV/EBITDA compare to Mastercard and PayPal?
Show the latest intraday price, daily change (%), trading volume, market capitalization, and TEV for NVIDIA, TSMC, and Intel
Macroeconomic Data
What are Germany's GDP growth drivers and demographic trends contributing to its structural headwinds in 2026?
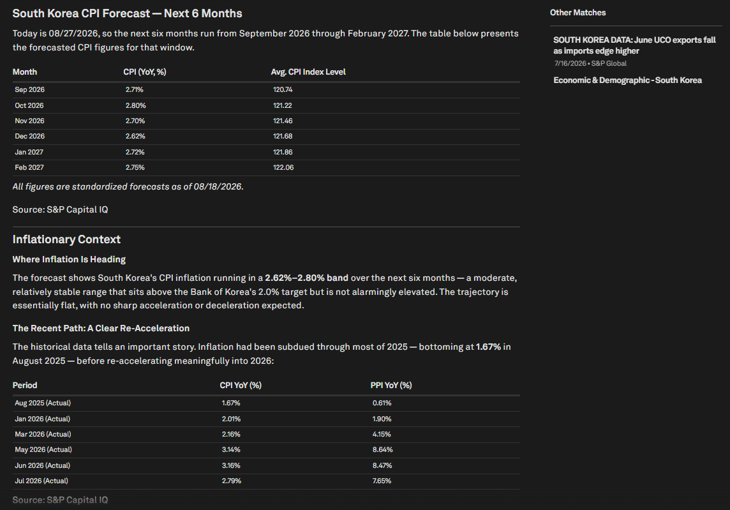
What are South Korea's CPI numbers for the next 6 months, and provide context to the inflationary environment
Indices
How have the top 3 constituents by weight in the S&P 500 performed in comparison to it over the past week? Please give news for context
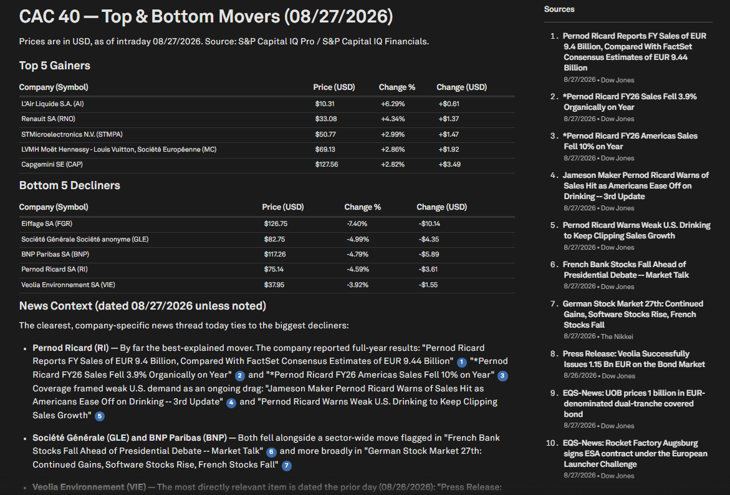
What were the top 5 and bottom 5 movers in the CAC 40 with news from today to provide context
Ownership
What % of Visa's Shares Outstanding is held by Institutions?
What are the institutional ownership trends for Apple’s ownership compared to its peers?
Transactions
What are the current implied deal multiples in the healthcare sector?
Evaluate Eli Lilly's M&A strategy compared to its peers
Issuer and Issue-Level Credit Ratings
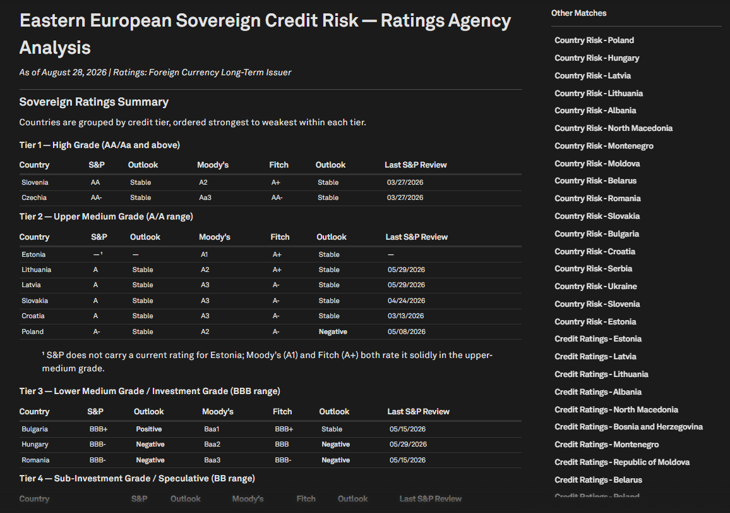
Analyze the credit risk from the ratings agencies for the major Eastern European countries
Provide insight into the upgrades of Lumen Technologies' debt
Credit Default Swaps
How has the credit worthiness of UnitedHealth Group changed over the last 12 months?
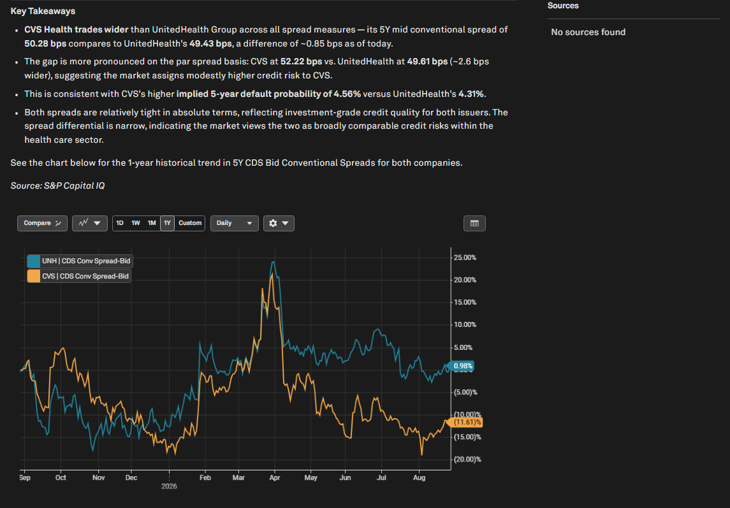
Compare the current 5- year CDS spread of UnitedHealth Group with that of CVS Health Corporation
Rates & Yields
What is the impact of the Fed's rate changes on the US banking industry?
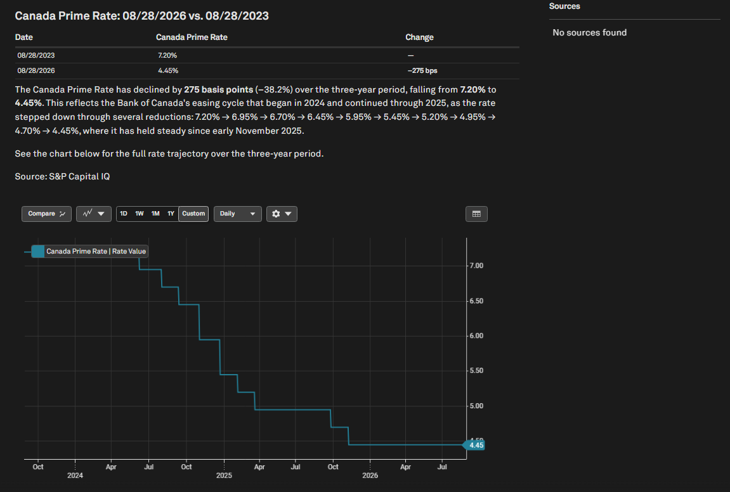
Compare the Canada Prime Rate as of today to 3 years ago
Saved Lists and Peers
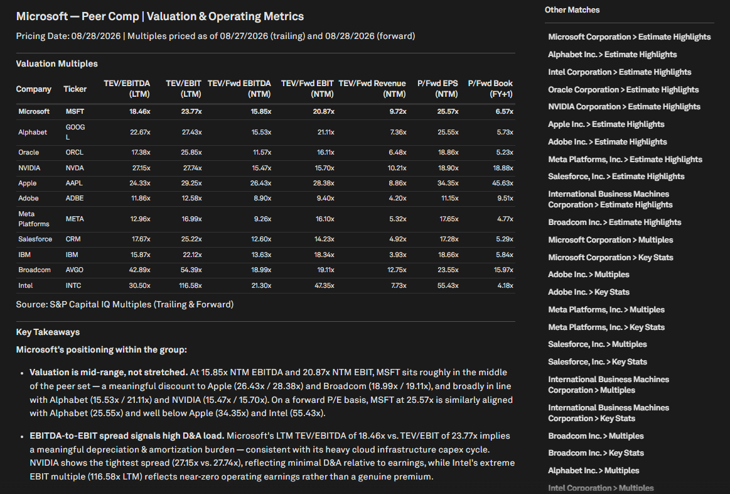
Show me the peer comp for Microsoft and highlight the key valuation and operating metrics across the group
Use the CIQ Pro prebuilt AI Monitor by Visible Alpha list to identify which companies are trading at the highest forward EBITDA multiples and summarize what stands out
Company Screening
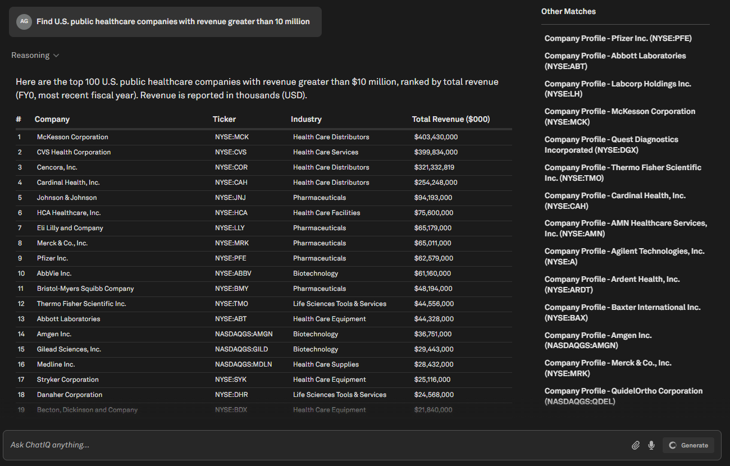
Find U.S. public healthcare companies with revenue greater than 10 million
Show me the top 15 dental companies in Asia
Charting
Create a column chart of EBITDA Margin for the last 5 calendar years of Meta, Apple, Google and Microsoft
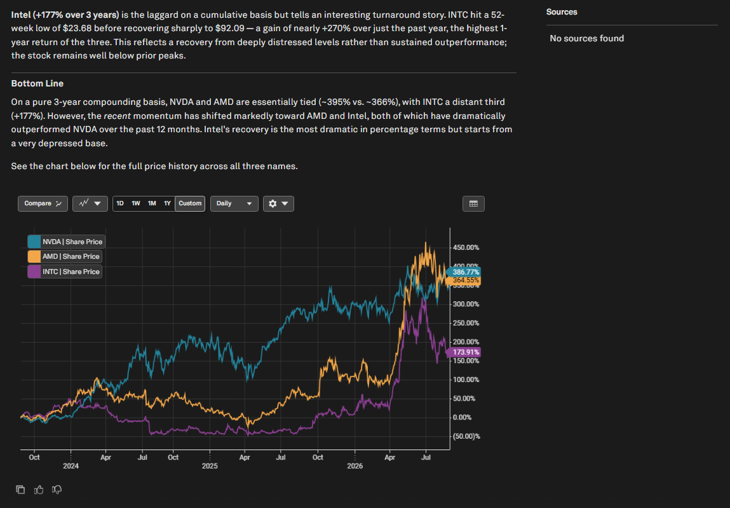
Compare NVIDIA, AMD, and Intel stock price performance over the past three years
Skills
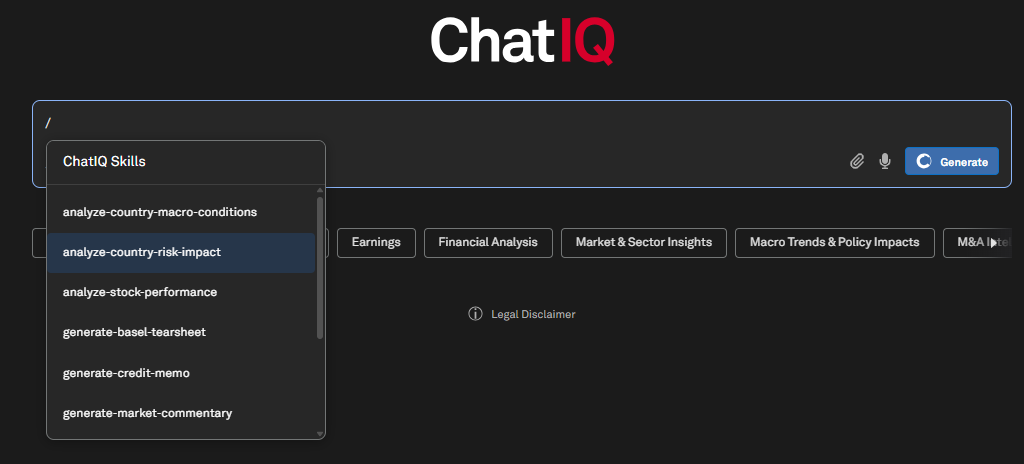
Users can now leverage Skills in ChatIQ for a more focused prompt. Using Skills in ChatIQ can be a quick start to familiarize yourself with the new enhanced offering.
Find it in the platform:
Navigate to ChatIQ in the top navigation
Type “/” followed by the Skill you want to leverage to access Skills
Skill Name | Example Prompt (Skill + below) |
Analyze Country Macro Conditions | Ukraine |
Analyze Country Risk Impact | Mexico |
Analyze Stock Performance | Nvidia |
Generate Basel Tearsheet | Bank of America |
Generate Credit Memo | Apple |
Generate Market Commentary | Technology within the S&P 500 |
Generate Private Company Tearsheet | OpenAI |
Generate Public Company Tearsheet | Ford |
Prepare Earnings Briefing | S&P Global |
Summarize Industry Developments | Homebuilding |
ChatIQ Spreadsheets
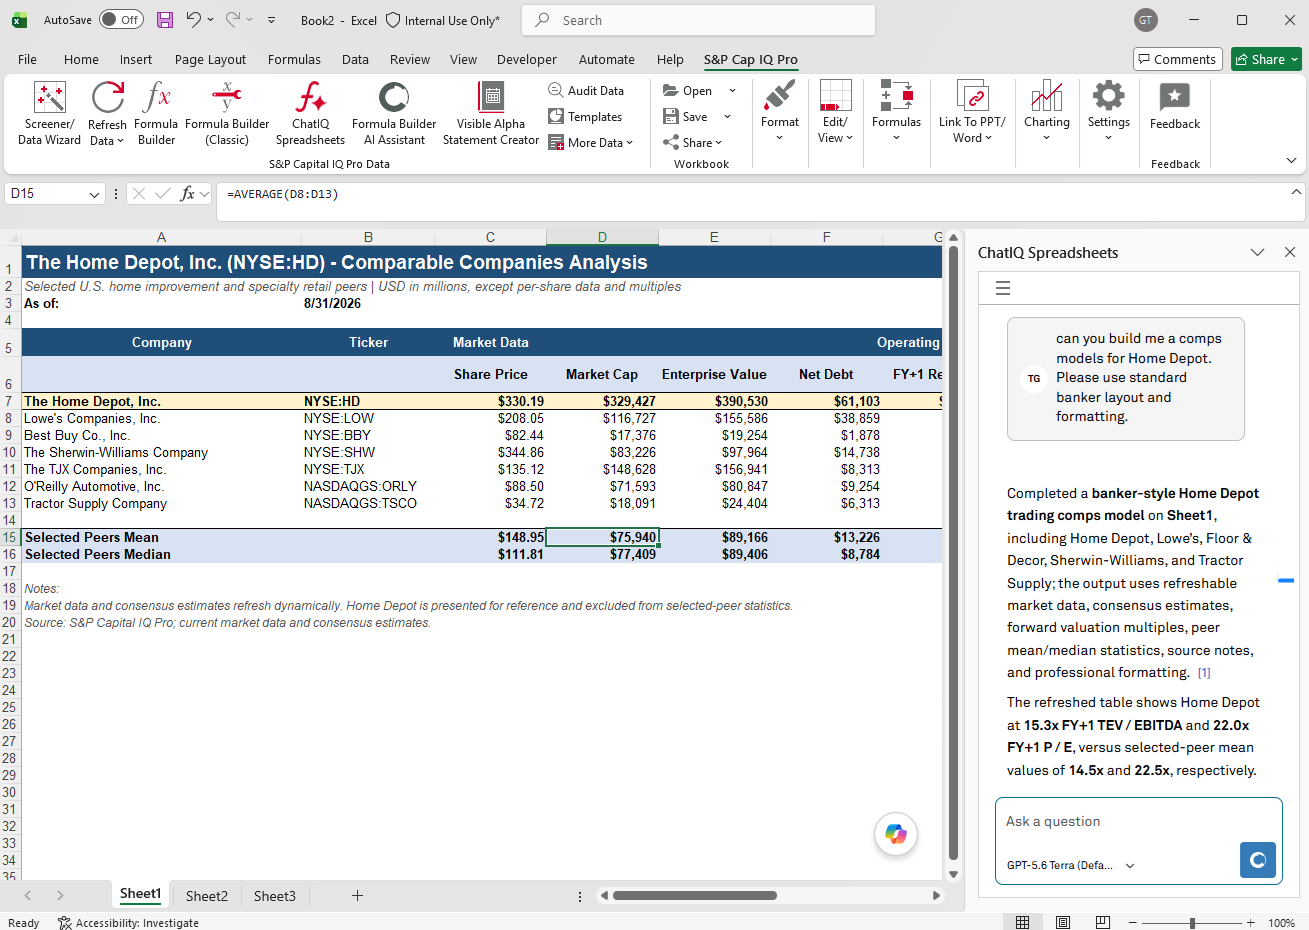
In this release, we launched the initial version of Capital IQ Pro’s GenAI-powered Excel modeling assistant, providing users with AI-powered tools to streamline modeling workflows and expedite analysis and insights within Excel.
ChatIQ Spreadsheets
Users can leverage ChatIQ Spreadsheets to gain insights on their existing models, build new models, or check models for errors and inconsistencies. New models are built using Capital IQ Pro formulas, so they are fully refreshable and auditable.
Find it in the platform:
As we build out these capabilities, we invite you to participate in the early versions. For early access, please reach out to your dedicated Account Manager to gain access to ChatIQ Spreadsheets Office Add-in from Microsoft Marketplace
ChatIQ Presentations
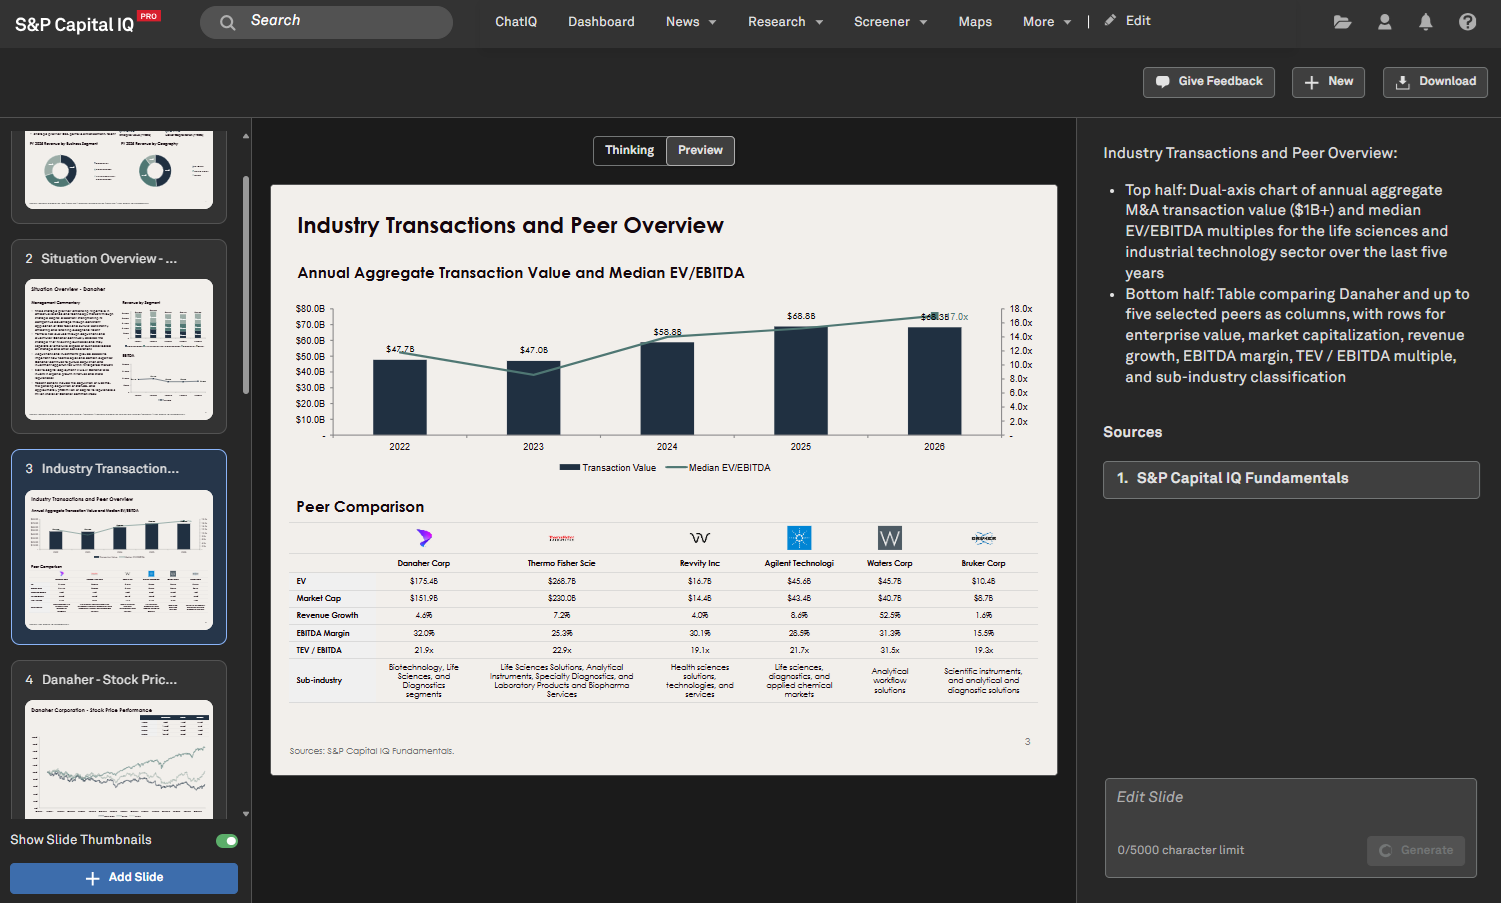
In this release, we launched ChatIQ Presentations, a new GenAI-powered PowerPoint presentation-building application, in our Labs environment, enabling users to quickly generate data-driven slides and presentations using trusted S&P Capital IQ Pro data.
ChatIQ Presentations
Users can create prompt-based slides and presentations with ChatIQ Presentations, which will be powered by S&P Capital IQ Pro data. Select from a range of predefined prompts to explore the breadth of capabilities, or create your own for tailored results. All exports to PowerPoint use native Office Objects, enabling seamless final adjustments. ChatIQ Presentations currently provides access to Capital IQ Pro’s financial data, market data, estimates, multiples, transaction statistics and financial documents, allowing users to easily combine data and insights.
Find it in the platform:
Navigate to Labs from the top navigation
If it is not visible, click Edit on the right side of the top navigation and add Labs from the Additional Menu Items and click Save
When in Labs, select the tile ChatIQ Presentations
Banks & Credit Unions
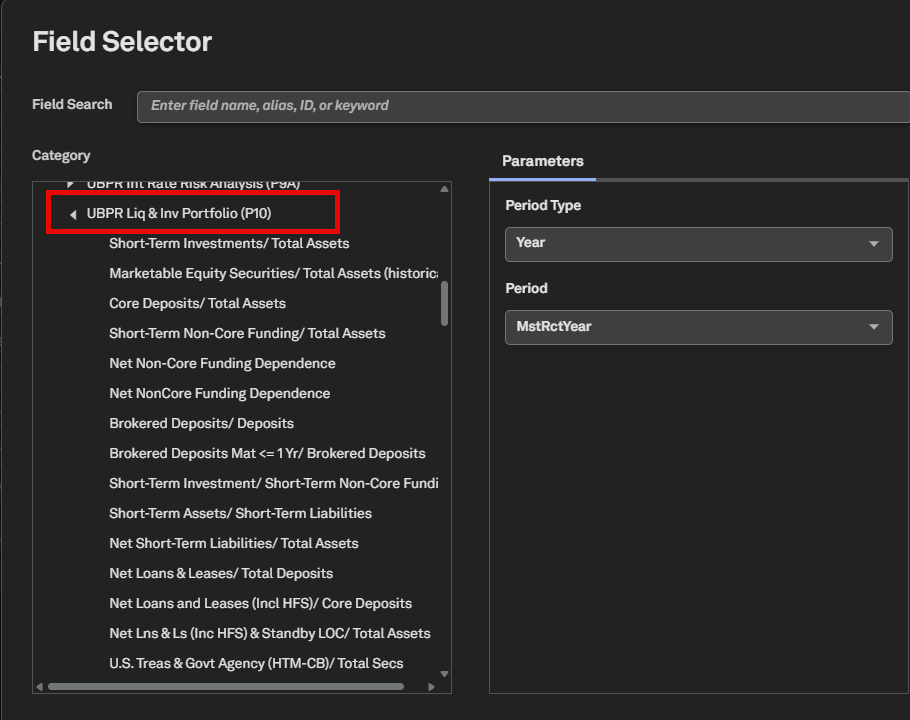
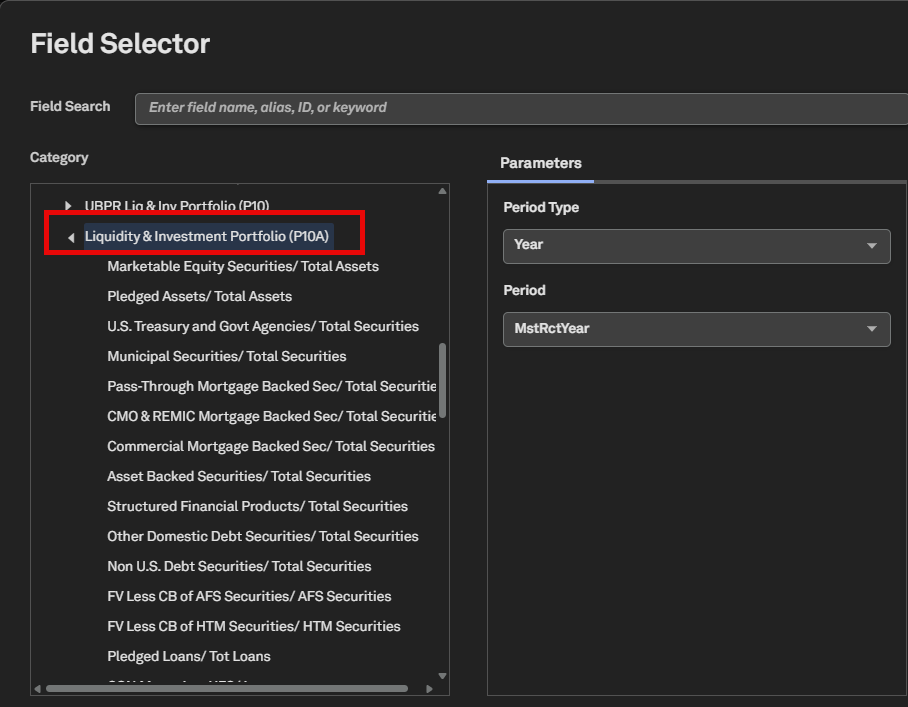
We expanded our U.S. banking data coverage with new Uniform Bank Performance Report (UBPR) data points - Page 10 (Liquidity & Funding) and Page 10A (Liquidity & Investment Portfolio), and introduced Leverage Buffer Requirements and Leverage Buffer Ratios, providing deeper insights into excess leverage capital requirements and buffer percentages. The Corporate Profile now features U.S. bank regulatory identifiers, including BHC Number, Federal Reserve ID, Certificate Number, and NCUA Charter Number (where applicable). These enhancements are available across Screener, Company Financials, and Corporate Profile, improving access to U.S. banking regulatory data for more efficient analysis and screening. Additionally, we added new Net Stable Funding Ratio (NSFR) and Liquidity Coverage Ratio (LCR) fields for U.S. Banks in Screener, providing valuable insights for counterparty risk management and peer benchmarking.
Addition of new UBPR Page 10 and Page 10A Data Items in Screener
Users can access new UBPR fields, including Page 10 (Liquidity & Funding) and Page 10A (Liquidity & Investment Portfolio), enabling more comprehensive regulatory reporting and analysis.
Find it in the platform:
Navigate to Screener from the top navigation or the Apps & Links menu
Select Industry & Asset Data > Financials > Regulated Depositories (U.S.)
Within Criteria, select Company Type as Commercial Bank, Savings Bank and set the Entity Type dropdown to Companies
Click Display Columns, expand Bank Reg Financials (UBPR) > UBPR Liq & Inv Portfolio (P10) and Liquidity & Investment Portfolio (P10A)
Similarly, within the Companies dataset, expand Financials > U.S. Bank Regulatory Financials > UBPR, UBPR Liq & Inv Portfolio (P10) and Liquidity & Investment Portfolio (P10A) categories
Coverage stats:
57 data items are added for UBPR Page 10, and 34 data items are added for UBPR Page 10A
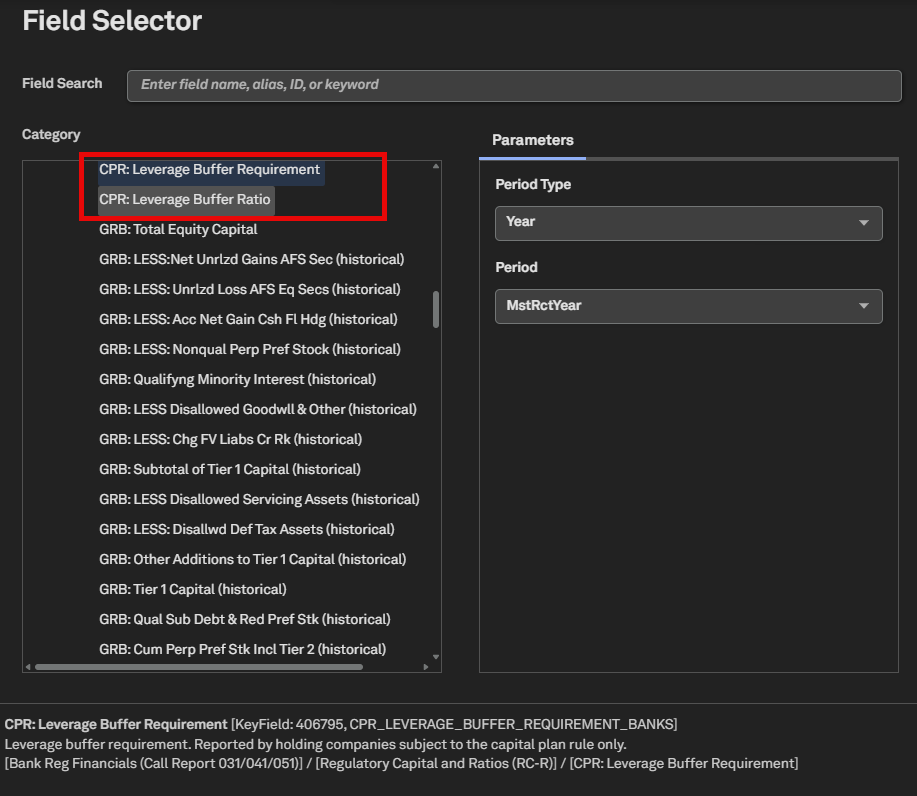
CPR Leverage Buffer Requirements and Ratios for U.S. Banks
Users can access CPR Leverage Buffer Requirements and CPR Leverage Buffer ratios for U.S. banks in Screener. This indicates the required excess leverage capital and percentage points above the minimum leverage requirement.
Find it in the platform:
Navigate to Screener from the top navigation or the Apps & Links menu
Select Industry & Asset Data > Financials > Regulated Depositories (U.S.)
Within Criteria, select Company Type as Commercial Bank, Savings Bank and set the Entity Type dropdown to Companies
Click Display Columns, expand Bank Reg Financials (Call Report 031/041/051) > Regulatory Capital and Ratios (RC-R)
Similarly, within the Companies dataset, expand Financials > U.S. Bank Regulatory Financials > Bank Reg Financials (Call Report 031/041/051) > Regulatory Capital and Ratios (RC-R)
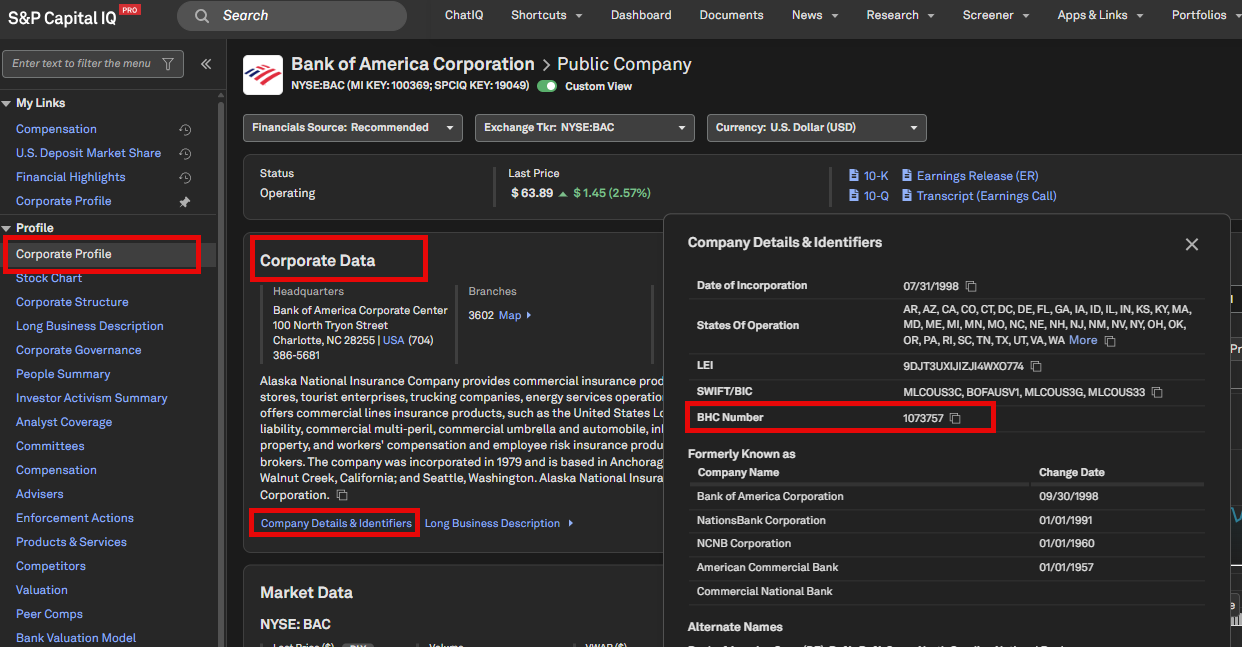
U.S. Bank Regulatory Identifiers on the Company Details
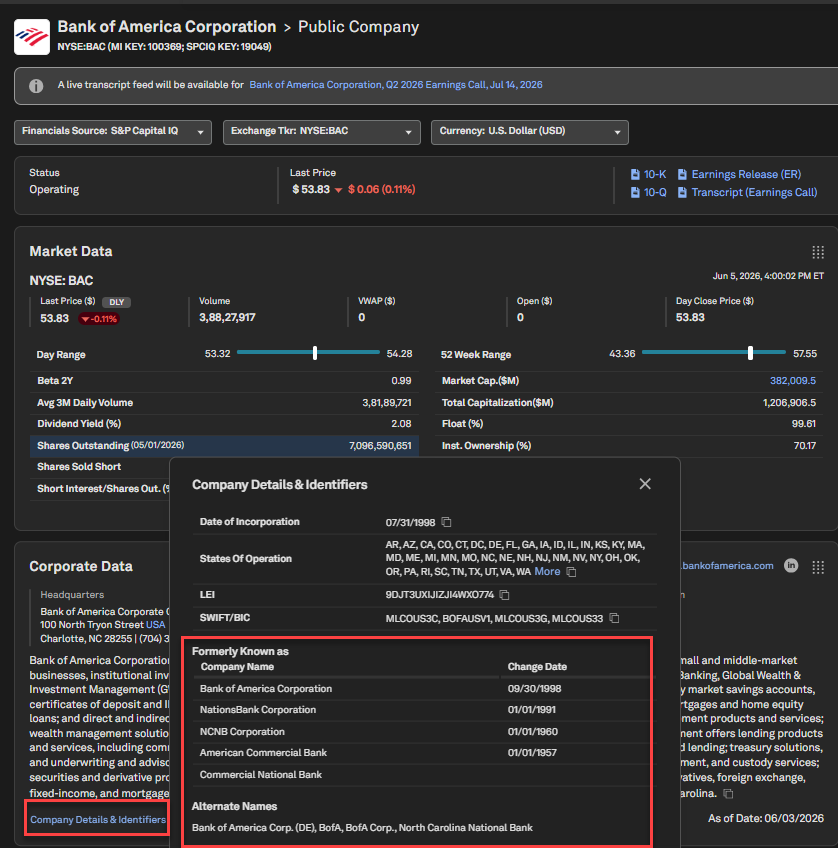
Users can access key U.S. bank regulatory identifiers, including BHC Number, Federal Reserve ID, Certificate Number, and NCUA Charter Number (where applicable), in the Company Details & Identifiers section of the Corporate Profile.
Find it in the platform:
Search and select a U.S bank in the top search to navigate to its Corporate Profile
In the Corporate Data widget, click on Company Details & Identifiers at the bottom
View the identification details in the pop-up window
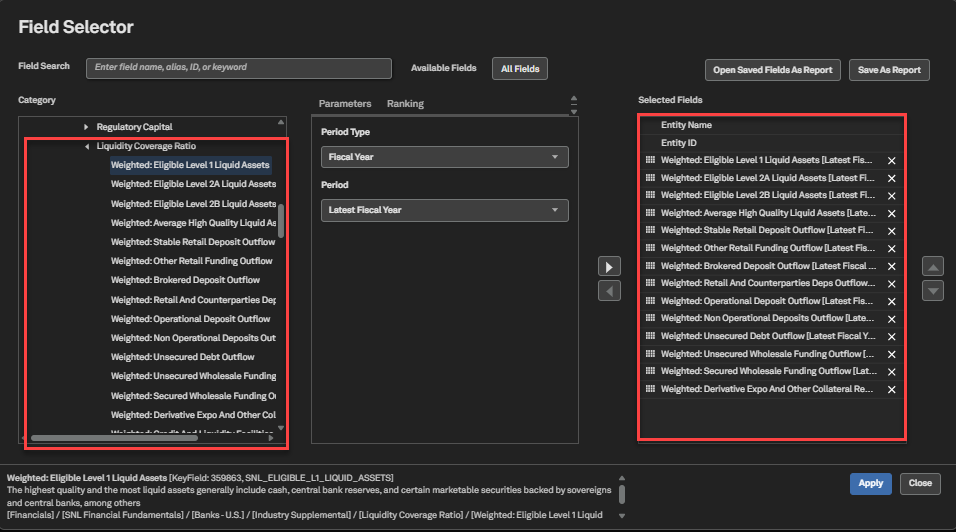
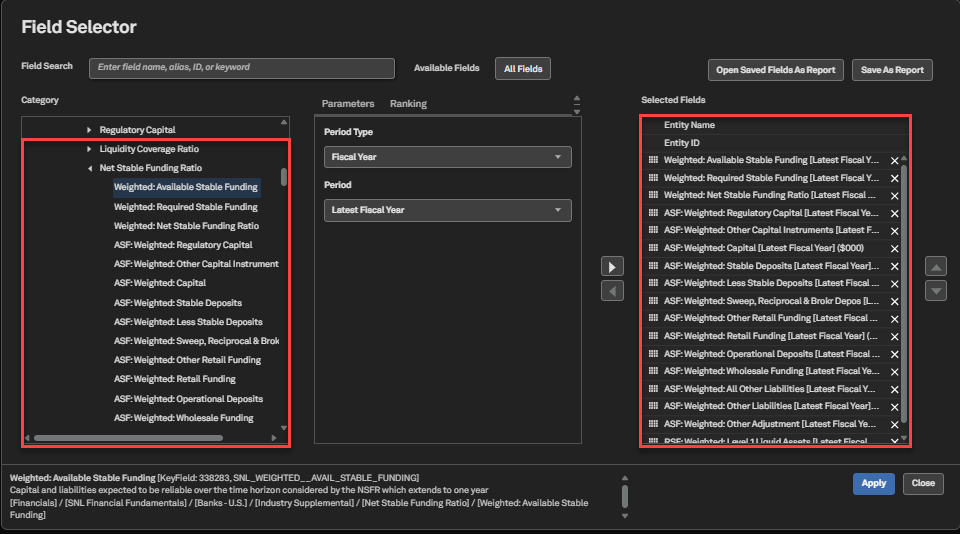
Liquidity Coverage Ratio Unweighted Cash Flows and Net Stable Funding Ratio Expansion
Users can now access 187 Net Stable Funding Ratio (NSFR) fields and 28 Liquidity Coverage Ratio (LCR) Unweighted Cash Inflows/Outflows fields across both the Companies and Companies (Classic) perspectives for U.S. banks in Screener. These enhancements improve visibility into key regulatory liquidity metrics, support stronger counterparty risk assessment, liquidity analysis, peer benchmarking and help users better evaluate funding stability and liquidity positions.
Find it in the platform:
Navigate to Screener from the top navigation or the Apps & Links menu
Select Companies or Companies (Classic)
Select Banks from the Industry Classification dropdown and USA as the Geography
In the Add Criteria, expand Financials > SNL Financial Fundamentals > Banks U.S. > Industry Supplemental > Regulatory Capital to find new subcategories for Liquidity Coverage Ratio and Net Stable Funding Ratio
Coverage stats:
U.S. Banks
Metals & Mining
In this release, we expanded our sustainability and cost analytics coverage to include Metallurgical/Coking Coal in the Mine Emissions Curve, introduced Modeled Emissions page for bulk commodities such as Manganese and Iron Ore, and extended the Modeled Cost page to cover Graphite properties. Additionally, we launched a new Short-Term Analytics suite—featuring Policy Pulse, Demand Pulse, and Supply Pulse—to help users monitor policy developments, demand trends, and supply-side dynamics shaping critical minerals markets
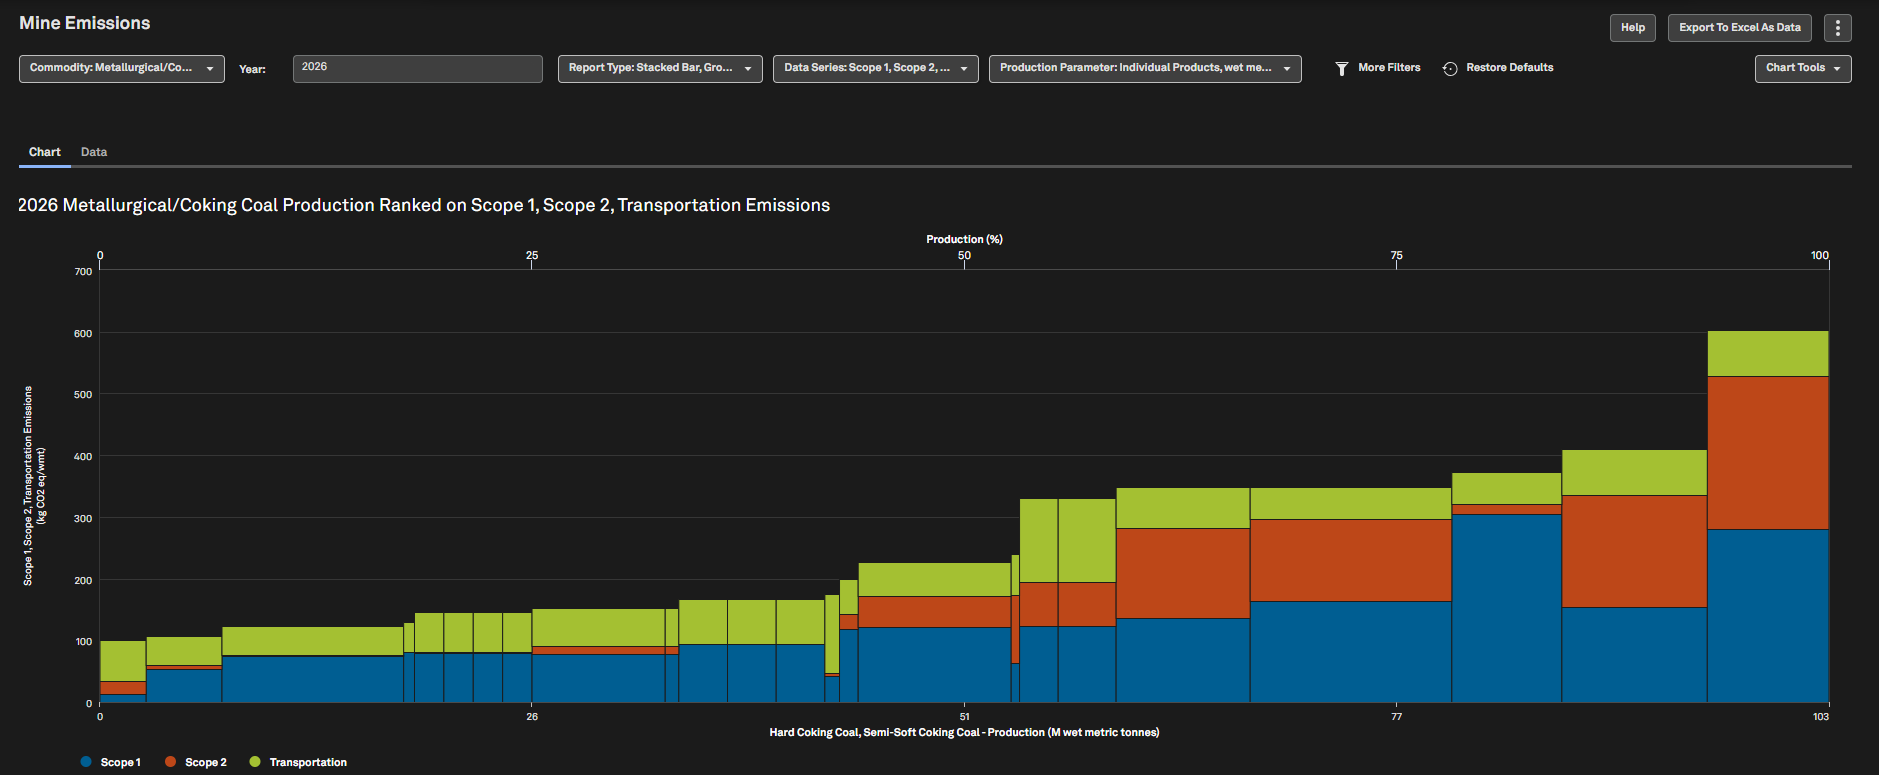
Metallurgical/Coking Coal Now Available in Mine Emissions Curve
The Mine Emissions Curve now includes Metallurgical Coal (Met Coal), a key steelmaking commodity. With this addition, users can assess emissions performance across Met Coal operations, benchmark assets, and incorporate emissions insights into operational, investment, and sustainability strategies.
Find it in the platform:
Navigate to Metals & Mining in the top navigation and select Mine Emissions Curve
Select Metallurgical/Coking Coal in the Commodity dropdown
Modeled Emissions Page for Bulk Commodities
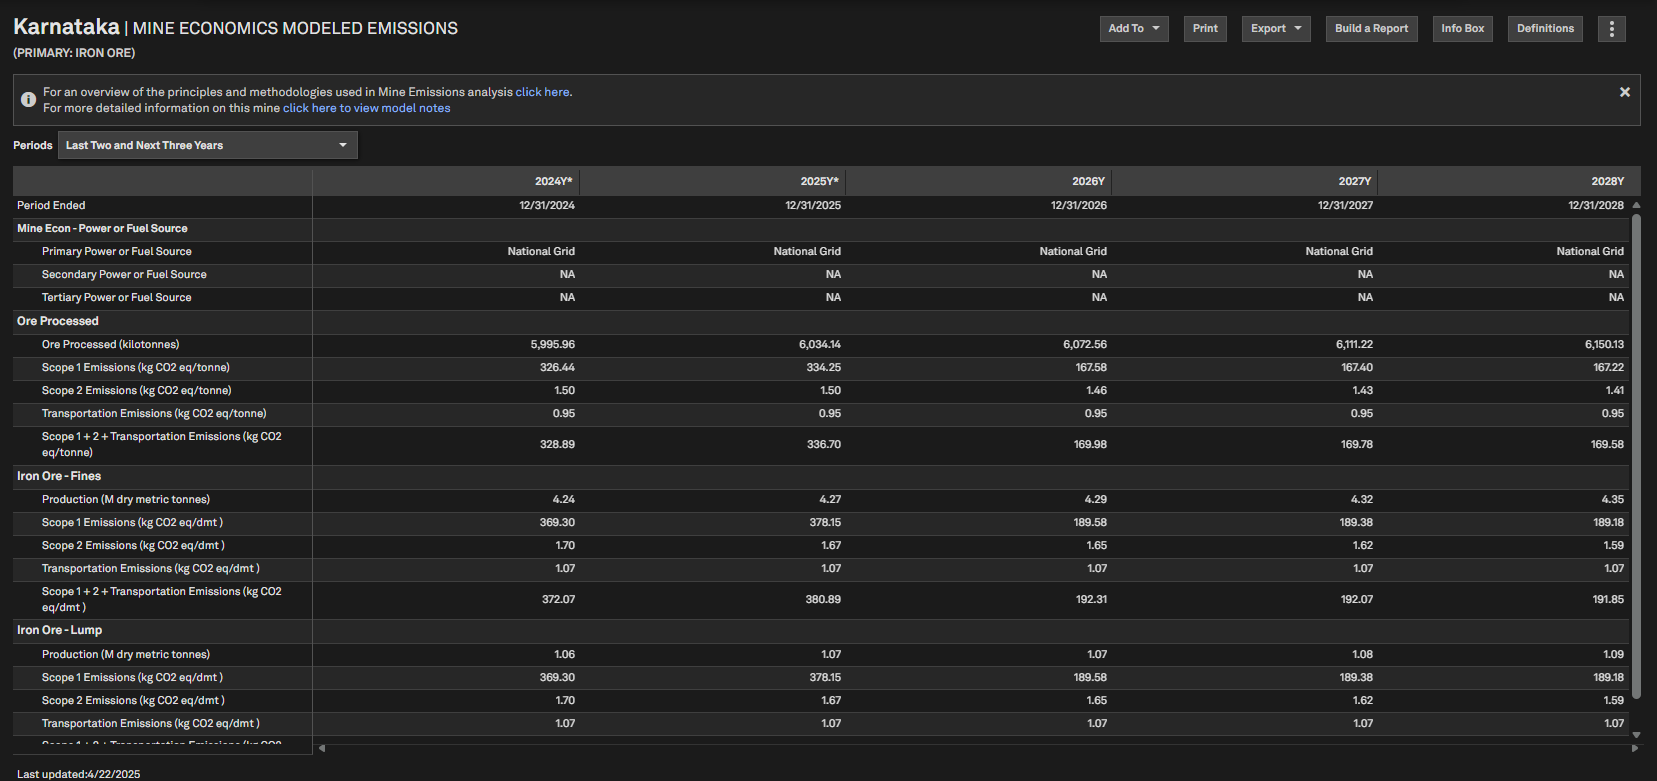
A new Modeled Emissions page is now available for bulk commodities, including Manganese and Iron Ore. This page provides long-term emissions projections and asset-level emissions data, enabling users to analyze future emissions trajectories, benchmark performance, and assess how operational and market developments could affect emissions outcomes.
Find it in the platform:
Search for and select an Iron Ore or Manganese property in the top search
In the left-hand navigation, expand Mine Economics and Emissions > Modeled Emissions
Modeled Cost Page Extended to Graphite Properties
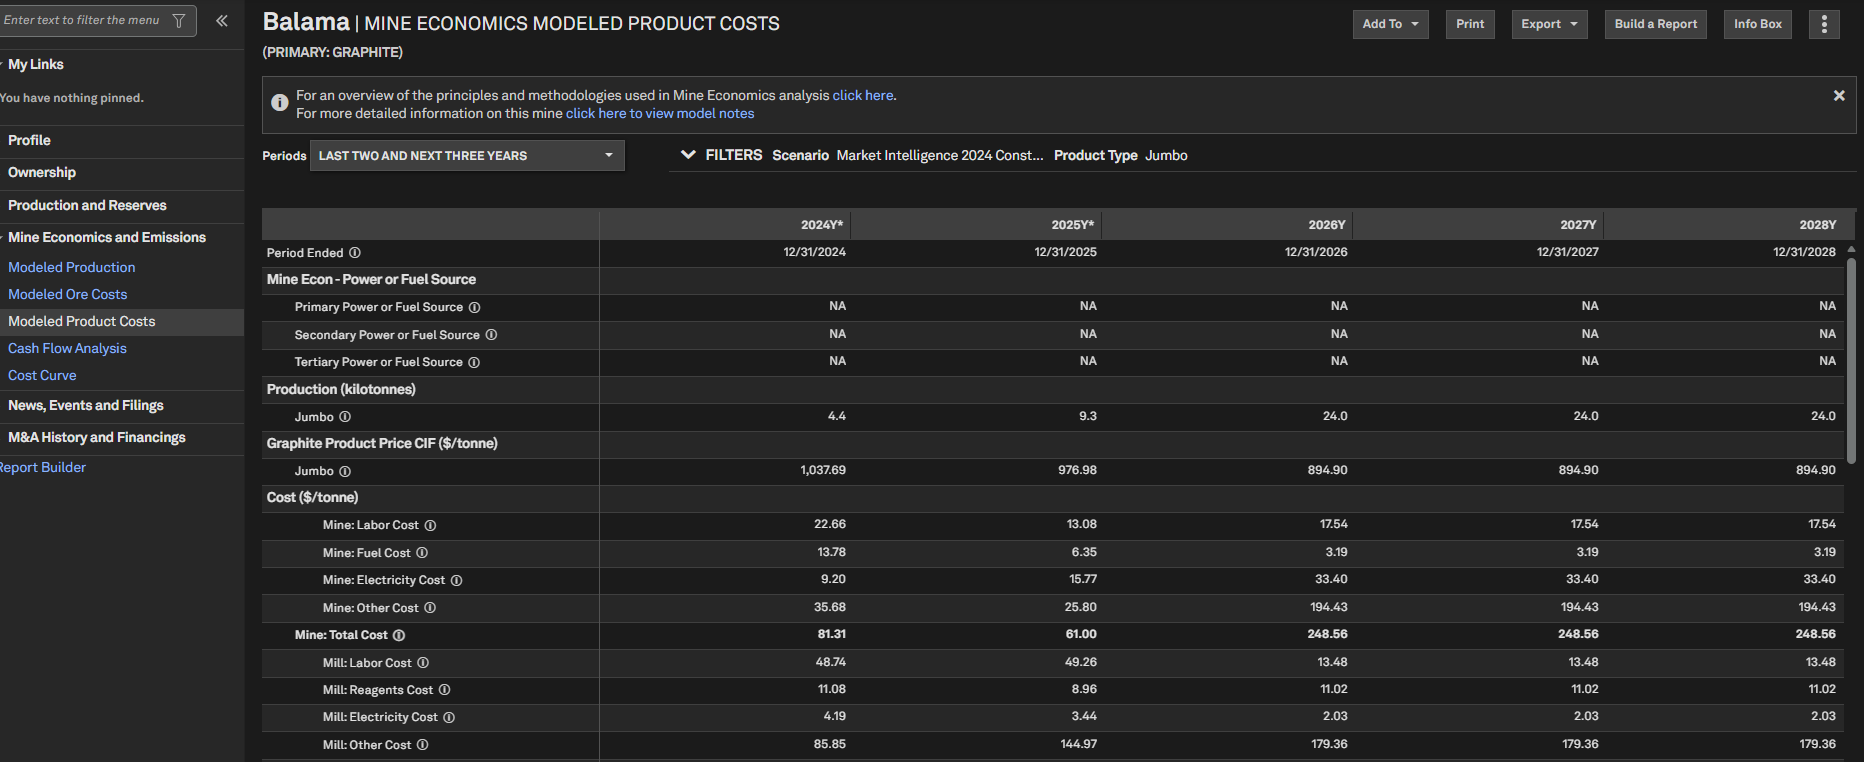
Modeled Cost pages now include Graphite properties, featuring Production, Ore Cost, Product Cost, and Cash Flow Analysis. These modeled views enable users to assess long-term cost structures, production outlooks, and project economics, supporting strategic planning, asset benchmarking, and investment evaluation.
Find it in the platform:
Search for and select a Graphite property in the top search
In the left-hand navigation, expand Mine Economics and Emissions
Select any Modeled Cost pages
Launch of Policy Pulse, Demand Pulse, and Supply Pulse for Critical Minerals
We are excited to introduce three new research offerings—Policy Pulse, Demand Pulse, and Supply Pulse—designed to deliver timely and actionable insights for critical minerals markets. These tools empower users to monitor policy and regulatory developments, analyze demand trends and end-use drivers, and track supply-side dynamics, supporting more informed market assessment and strategic decision-making.
Find it in the platform:
Navigate to the S&P Global Research Library in the top navigation
Select Industry as Metals & Mining
In the Report Type filter, select the newly available report types and click Apply
New reports will appear in the Results section
Energy
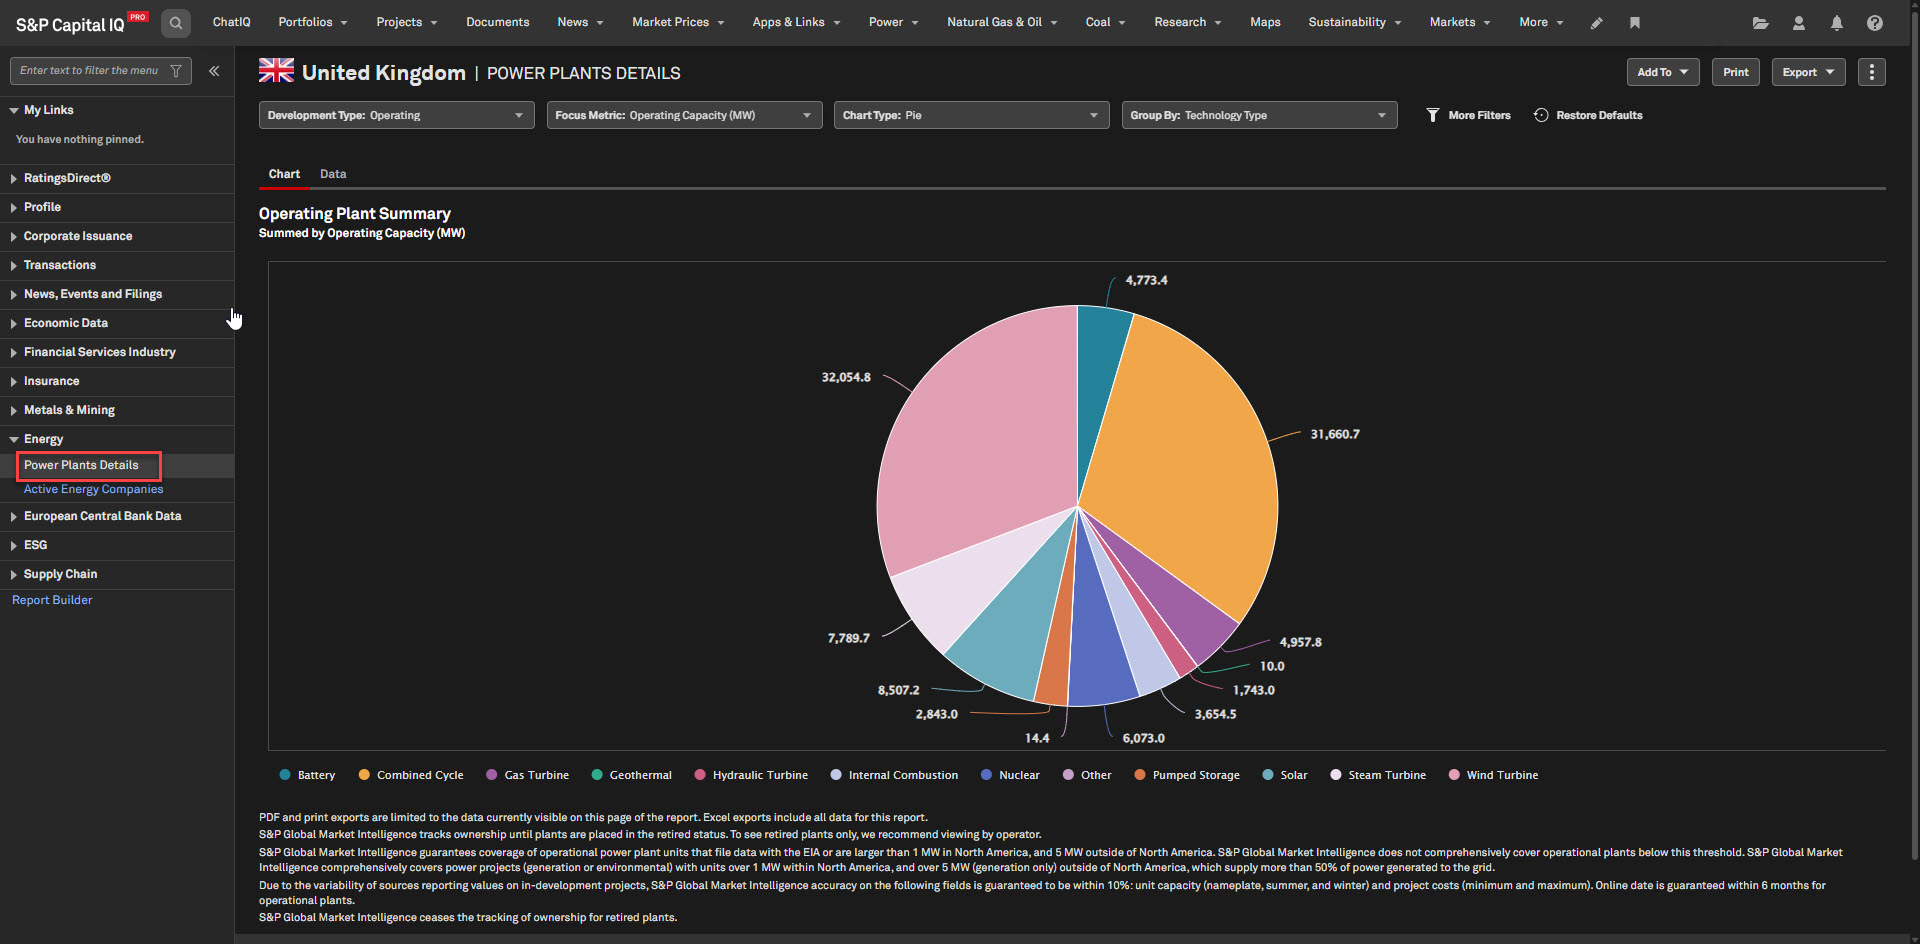
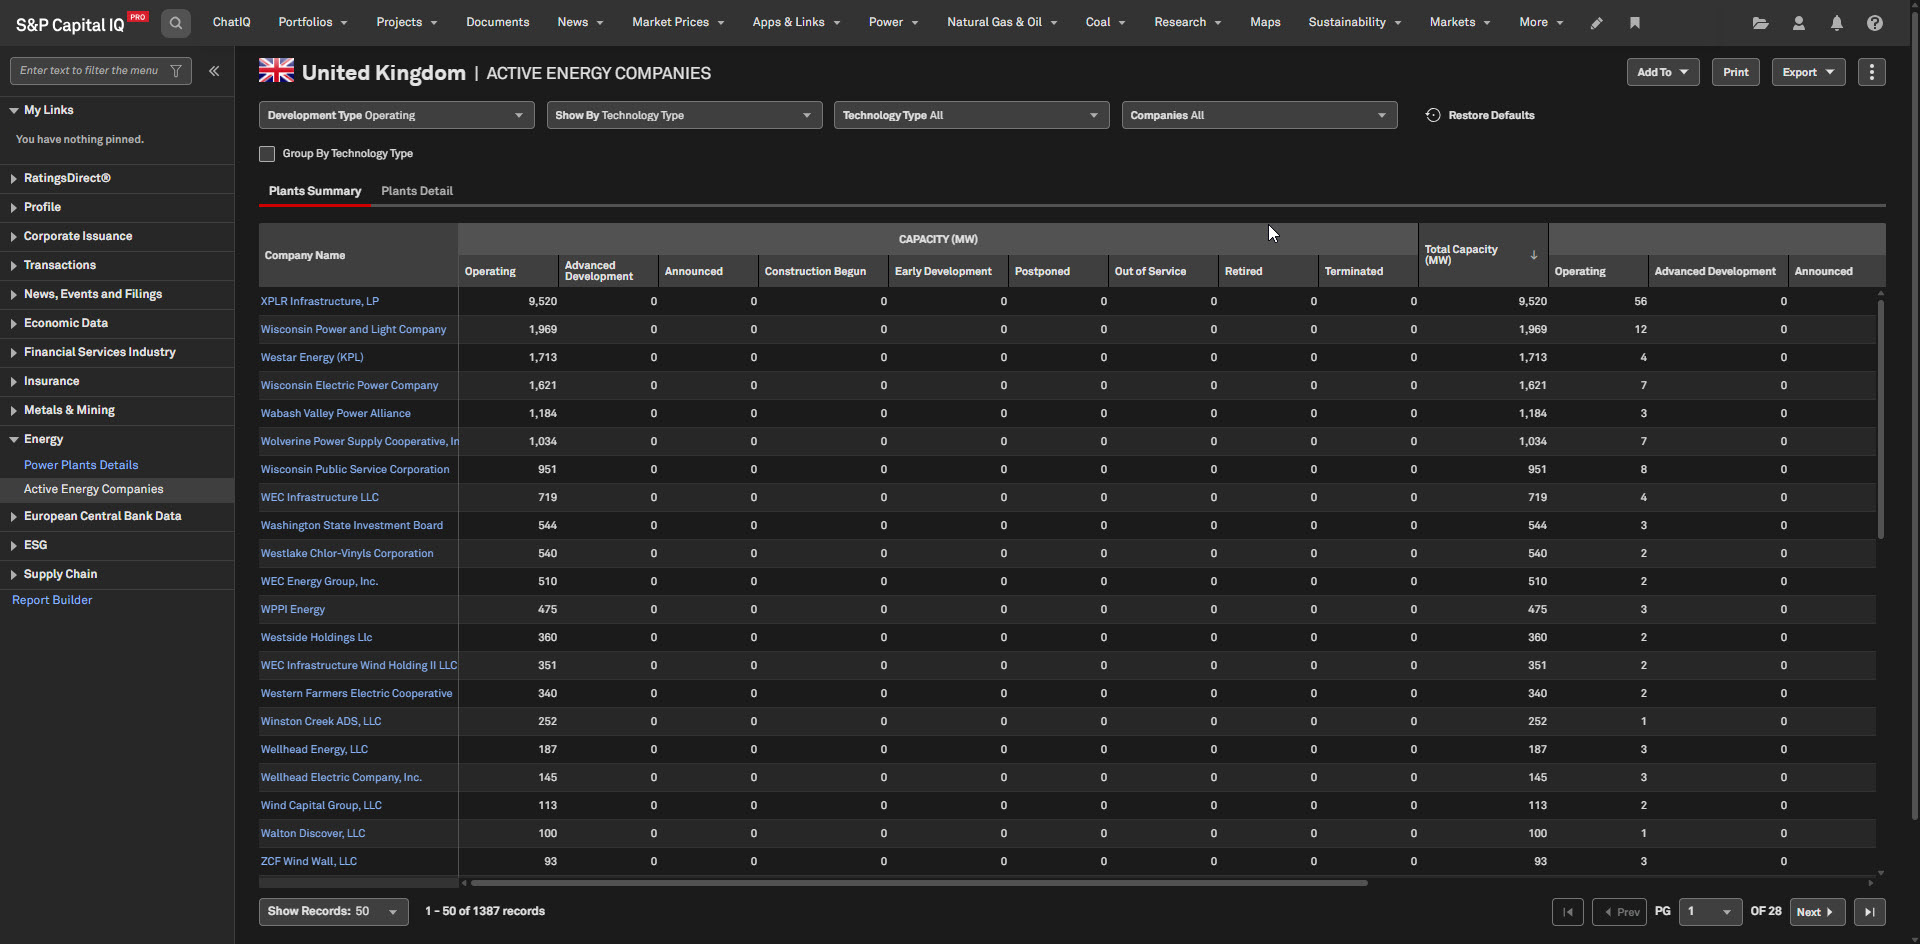
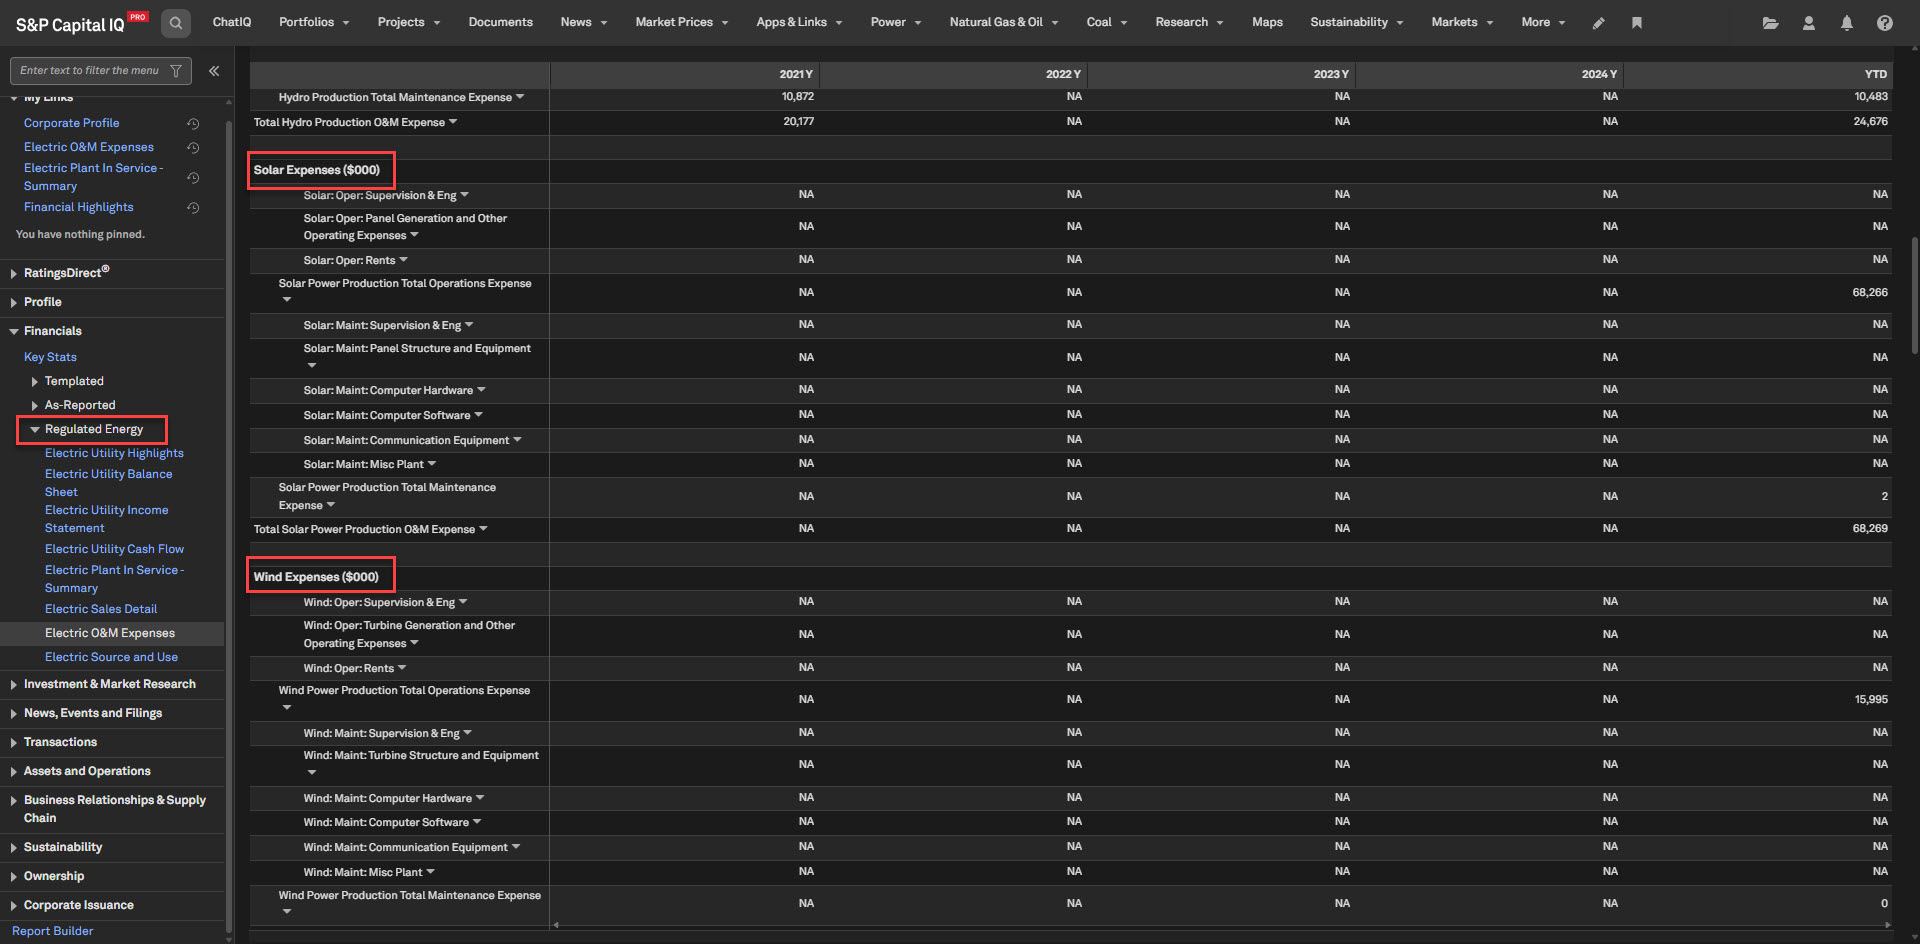
In this release, we added Energy profiles to the Country Briefing Books, featuring Power Plant details and active Energy Company information. Additionally, the new Renewable & Storage fields from Electric FERC Form 1 are incorporated into Regulated Energy Financials for utilities.
Energy Profiles
Users can now access Energy Profiles in the Country Briefing Books. These profiles allow tracking of current and future power plant capacity, supporting market sizing, M&A analysis, and fleet structure evaluation.
Find it in the platform:
In the Energy profile specialization, navigate to Markets from the top navigation menu
Under the Geographies section, select a Country to access its profile
FERC Renewable & Storage data
Users can access Solar, Wind, Storage and other storage data within the regulated energy financials of a power utility briefing book to benchmark electric utility expenses and compare the efficiency of renewable power production.
Find it in the platform:
In the Energy profile specialization, navigate to a power or a diversified utility
In the left-hand navigation, expand Financials > Regulated Energy and select Electric Operating Expenses
Coverage stats:
For all FERC Form 1 reporting entities starting in 2025
Insurance
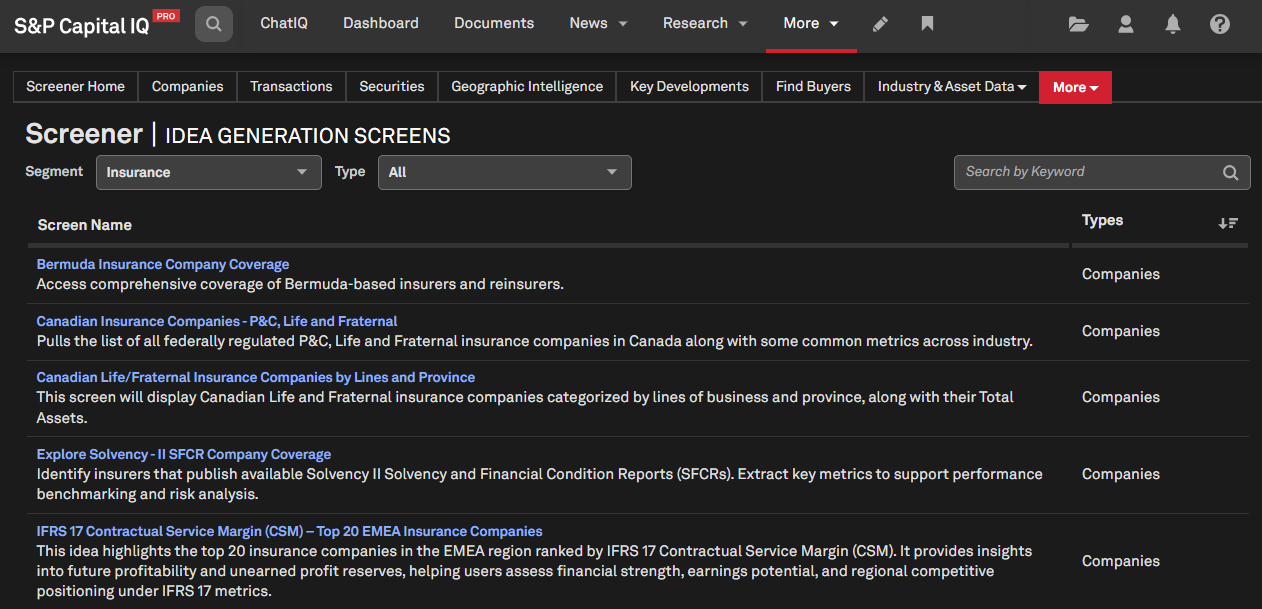
In this release, we added insurance-specific idea-generation screens across Investment Transactions, Investment Holdings, Reinsurance Relationships and Insurance Product Filings, including newly added company coverage.
Insurance Idea Generation Screens
Users can now access pre-configured, ready-to-use idea-generation screens directly within the Screener, streamlining day-to-day analysis and accelerating idea generation. These screens provide a solid foundation for further refinement and, where applicable, enable the creation of dedicated Idea screens linked to news articles, enabling a seamless transition from discovery to screening.
The following new Idea generation screens are now available:
Bermuda Insurance Company Coverage
IFRS 17 Contractual Service Margin (CSM) – Top 20 EMEA Insurance Companies
Explore Solvency - II SFCR Company Coverage
P&C Canadian Insurance Market Share by Insurance Revenue & Insights
Agency and Non-Agency RMBS and CMBS Investment Exposure Across P&C Insurers
Top 100 P&C Insurers: Market Position and Performance
Life Insurers’ Consolidated CLO Exposure View
Find it in the platform:
Navigate to Screener from the top navigation or the Apps & Links menu
Select Idea Generation Screens from the top menu
In the Segment filter, select Insurance to view the screens
Financials
In this release, we introduced customizable Total Enterprise Value (TEV) and related valuation multiples, enabling users to align with their preferred methodologies across financial pages, including Corporate Profile, Multiples, Key Stats, and Estimate Highlights.
Discounted Cash Flow (DCF) analysis for non-banking companies and point-in-time trading comparables are now available on the Valuations page. Users can now add existing company and transaction lists directly within the Trading Comparables and Precedent Transactions pages, respectively. We also enhanced export capabilities with PDF export, and updated Excel exports to include underlying calculations rather than static values—improving transparency and enabling deeper analysis.
Customizable Total Enterprise Value
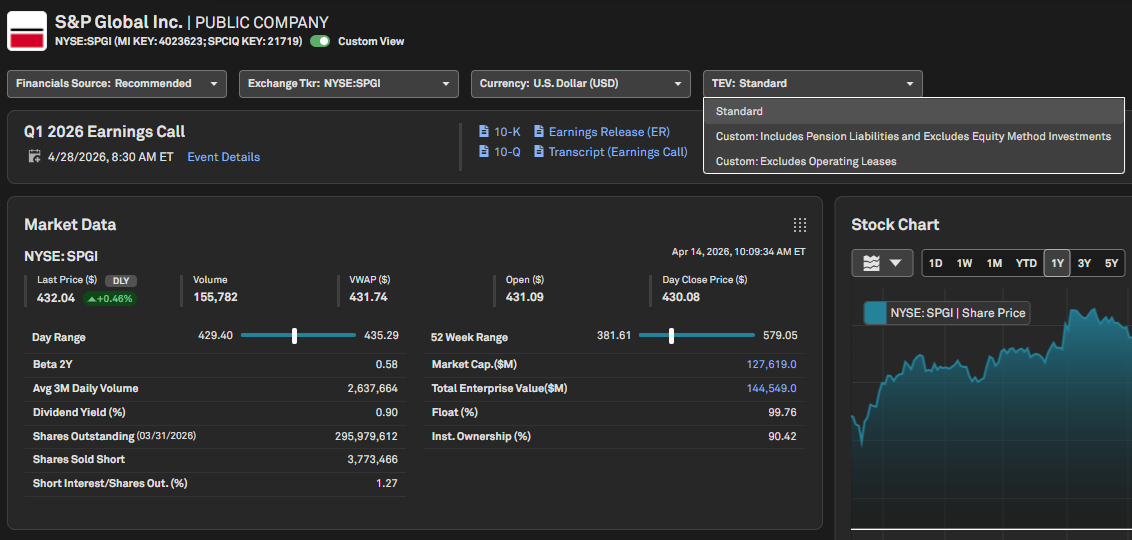
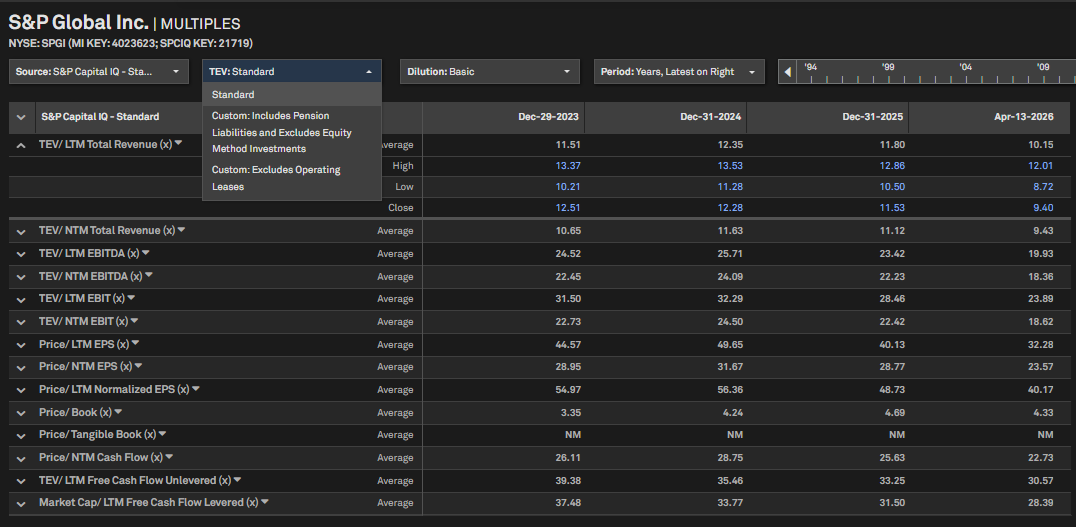
Users can now select from three Total Enterprise Value (TEV) calculation options—Standard TEV, TEV excluding operating leases, and TEV including pension liabilities while excluding equity method investments—and seamlessly switch between methodologies. TEV selection can be set at the user profile level for consistent application throughout the platform or adjusted via page-level filters for targeted analysis. This flexibility streamlines workflows and ensures alignment with internal valuation models and market conventions. All three TEV options are also available in Screener and the S&P Capital IQ Pro Plug-in.
Find it in the platform:
User Profile
Select the User Profile icon on the top right of the platform and click on User Profile & Display Information
Under Display Information, use CIQ TEV Calculation filter to choose the preferred TEV option to apply it throughout the platform
Company Profile
Search for and select a public company in the top search to navigate to its Corporate Profile
On the Corporate Profile, use the TEV filter at the top to choose the preferred TEV option
Similarly, go to Financials > Templated > Key Stats or Multiples, select the TEV filter, and choose the required TEV option
Navigate to Estimates > Estimate Highlights > use the TEV filter at the top to choose the preferred TEV option to view Multiples
Discounted Cash Flow (DCF) Analysis
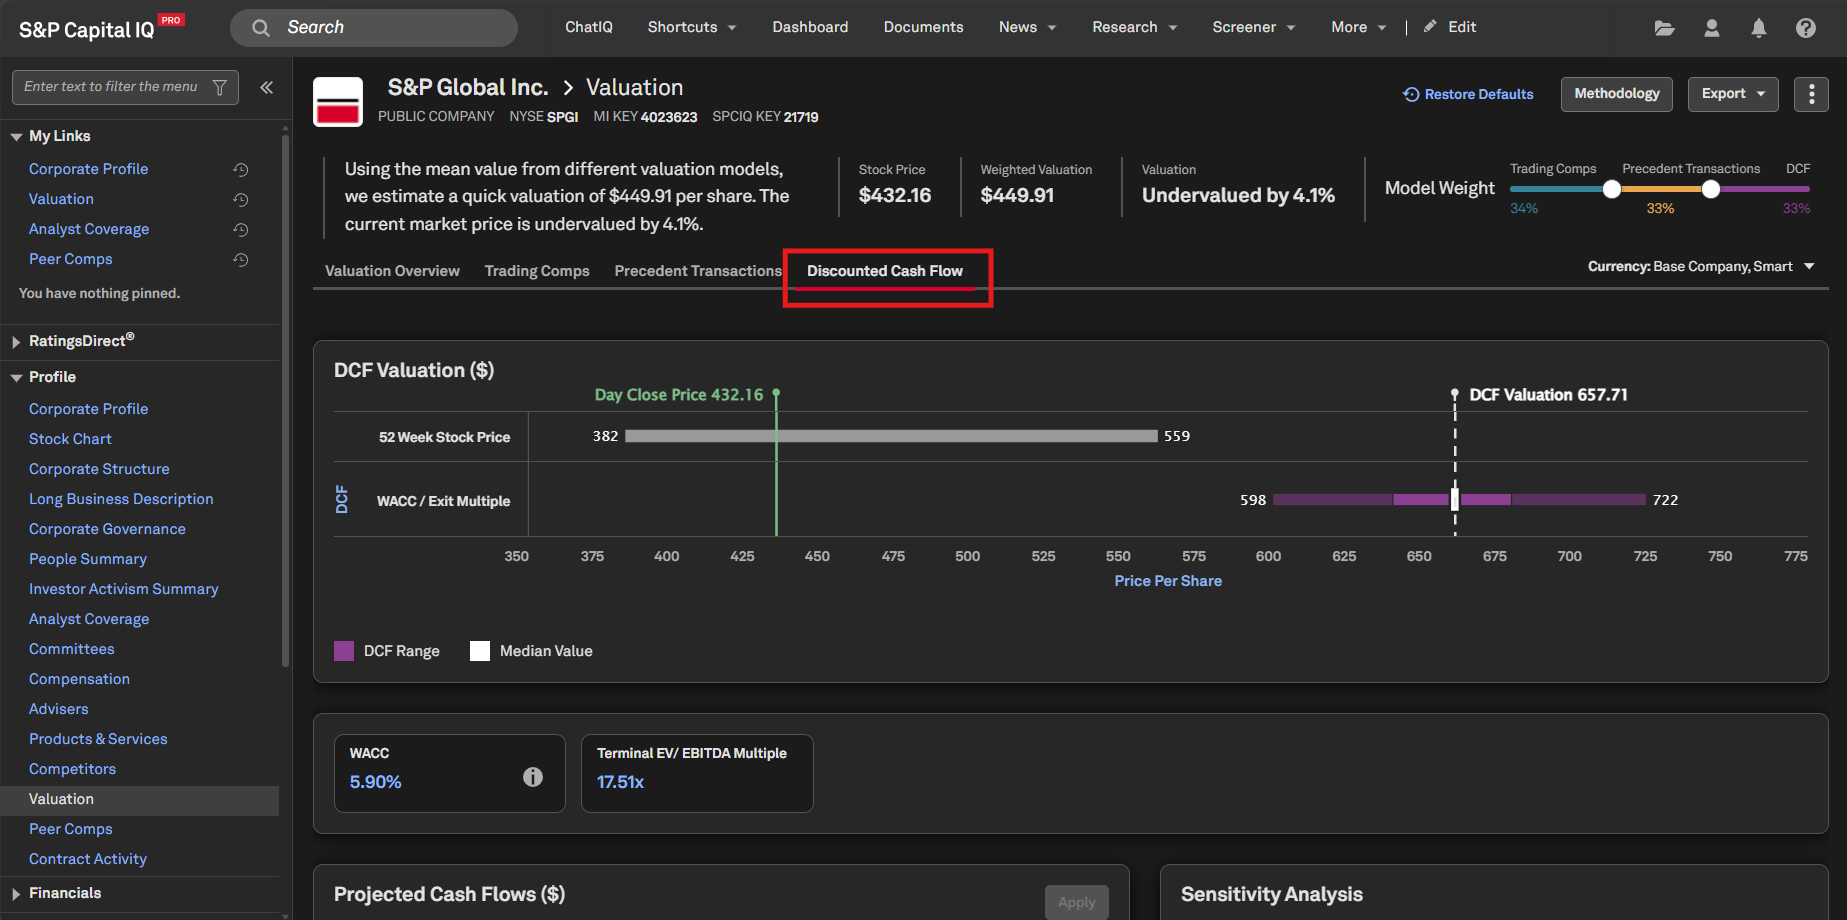
Users can now perform valuations using the Discounted Cash Flow (DCF) methodology for non-banking companies directly on a company’s Valuation page. As a widely used intrinsic valuation method, DCF complements existing market-based approaches by allowing users to assess a company’s worth based on its projected cash flows.
Find it in the platform:
Search for and select a public company in the top search, and navigate to Corporate Profile
Select the Valuations page in the left-hand menu under the Profile section
View the Discounted Cash Flow tab
Coverage stats:
Non-banking public companies
Point-in-time Trading Comps
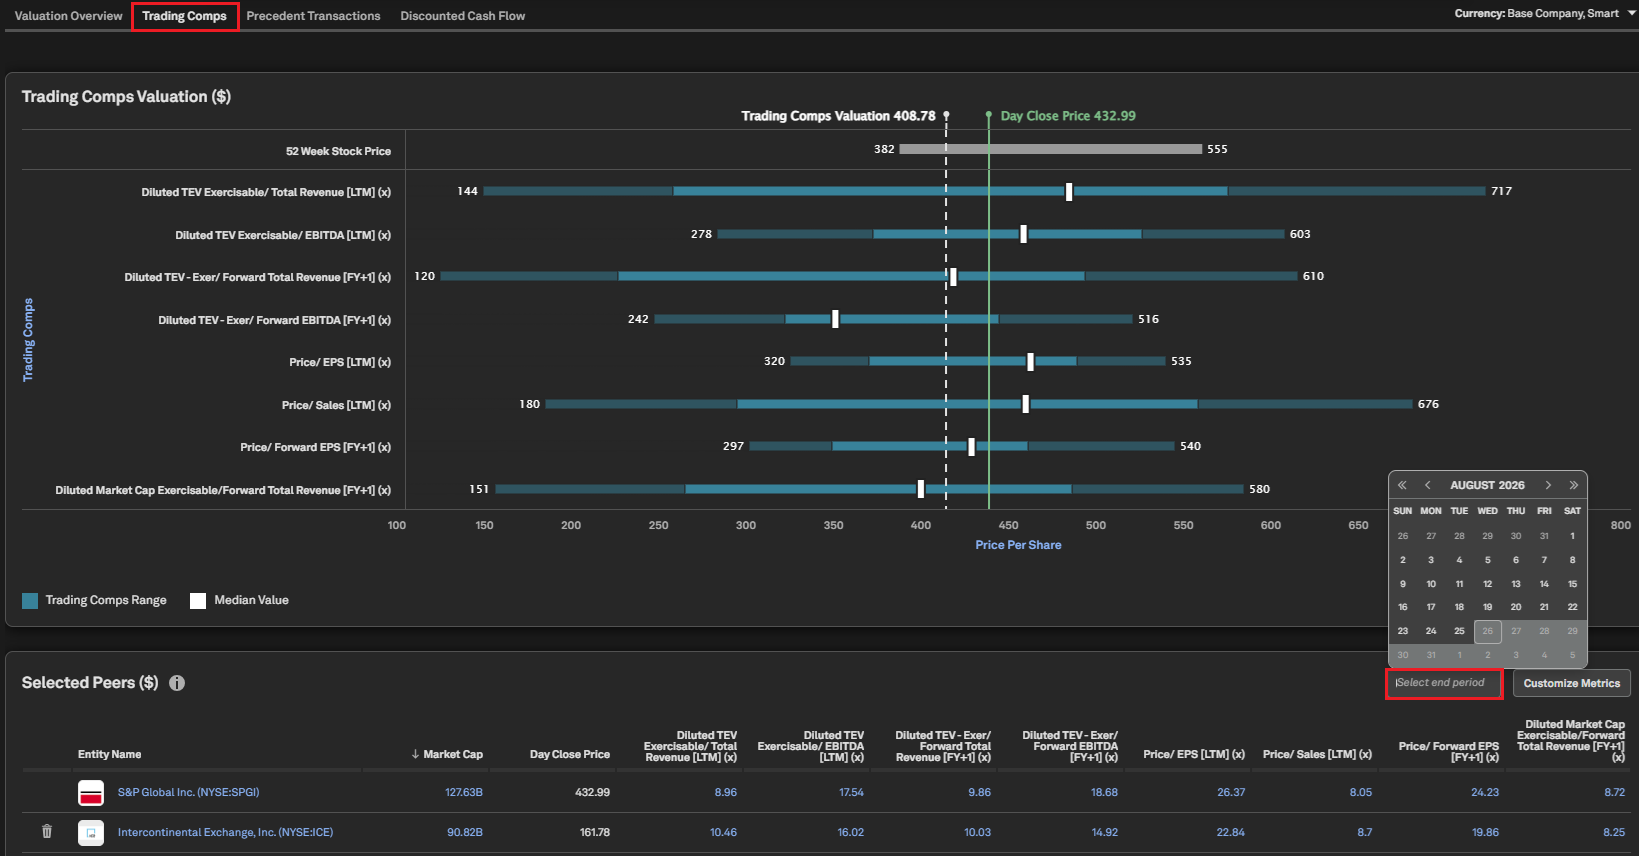
Point-in-time trading comparables are now available, enabling users to evaluate valuation multiples as they existed on specific historical date. This feature provides deeper insights into valuation trends over time and supports more accurate benchmarking in dynamic market environments. It effectively answers the question: ‘How much was a company worth as of a particular historical date based on its peer comparables?’, a valuable capability for tax audits and M&A analysis.
Find it in the platform:
Search for and select a public company in the top search, and navigate to Corporate Profile
Select the Valuations page in the left-hand menu under the Profile section
View the Trading Comps tab
Scroll down to the Selected Peers section and select the required date in the Select end period option to the right
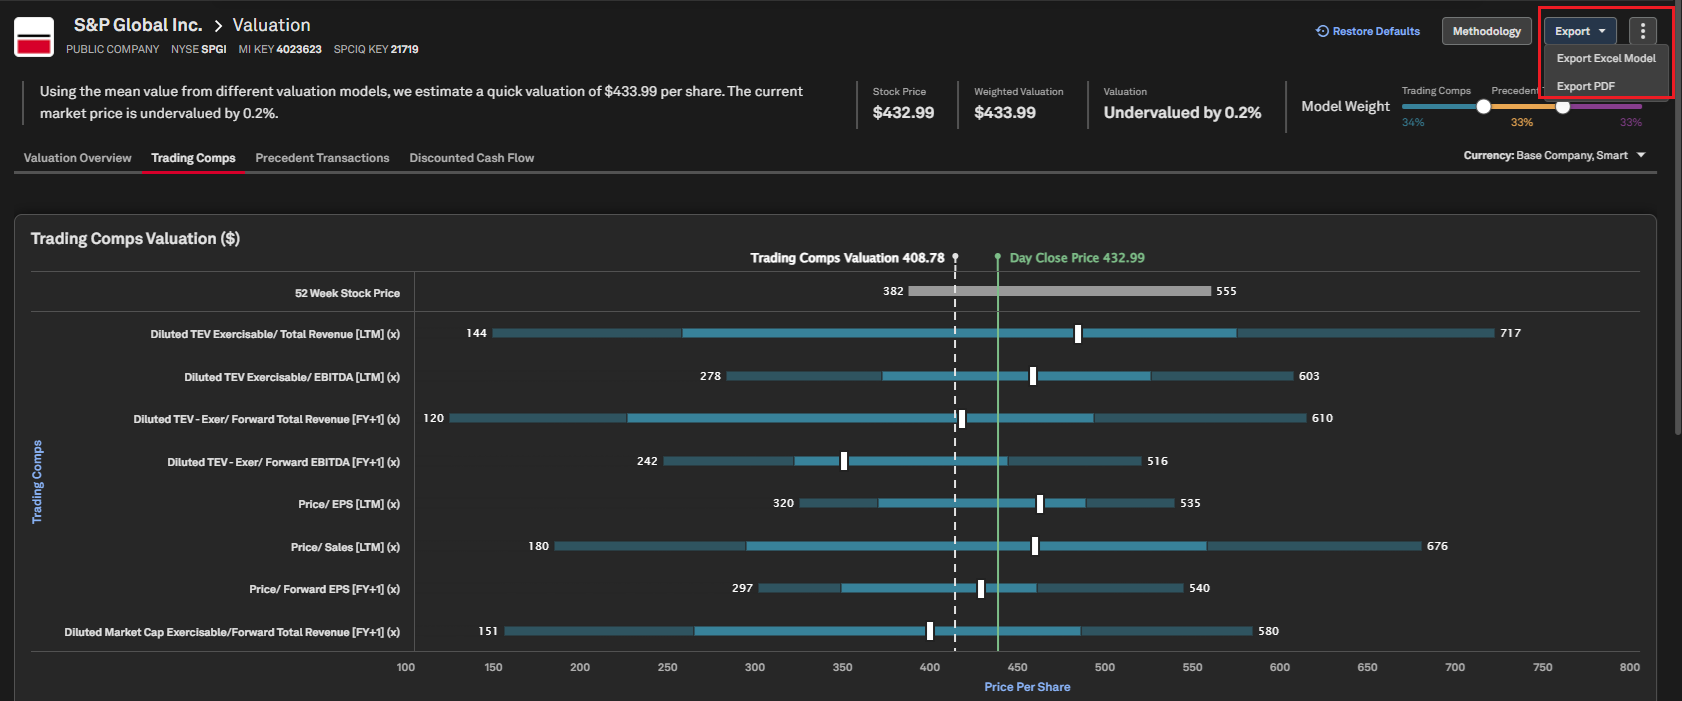
PDF Export for Valuation Results
Users can now export valuation results as PDFs, enabling seamless sharing with stakeholders.
Find it in the platform:
Search for and select a public company in the top search, and navigate to Corporate Profile
Select the Valuations page in the left-hand menu under the Profile section
Select Export > Export PDF at the top right
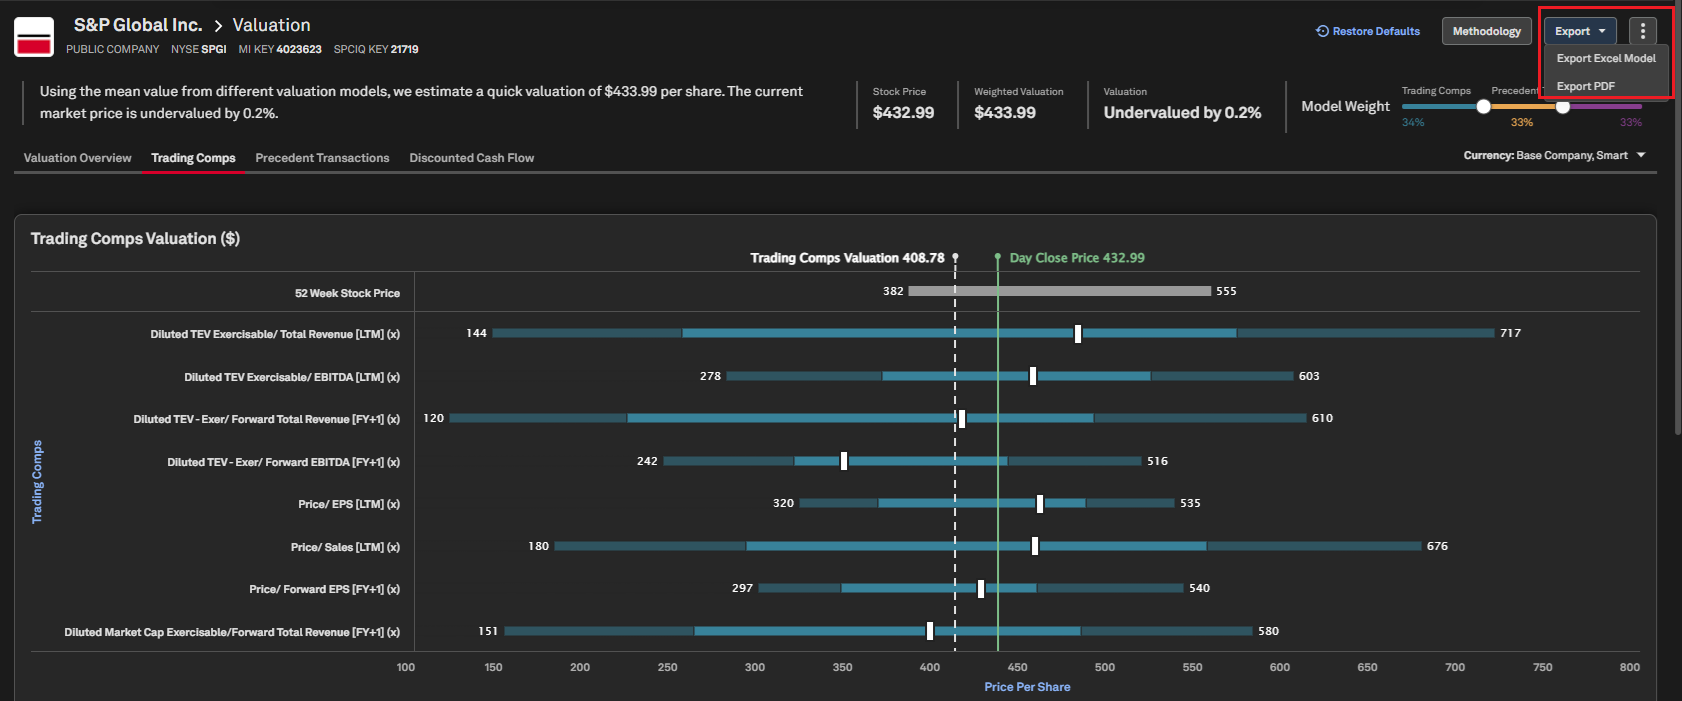
Formula-based Valuation Exports in Excel
Users can now export valuations to Excel with underlying formulas and calculations, rather than static values, providing greater visibility into valuation methodologies and enabling deeper analysis.
Find it in the platform:
Search for and select a public company in the top search, and navigate to Corporate Profile
Select the Valuations page in the left-hand menu under the Profile section
Select Export > Export Excel Model at the top right
Visible Alpha
In this release, we added ‘as-of’ historical dates for Visible Alpha consensus estimates, offering a clear perspective on how The Street’s expectations shifted during key corporate events—such as earnings announcements, guidance changes, acquisitions, delistings, and other corporate actions. Users can now access historical estimates for both actively covered companies and those where broker coverage ended, enabling deeper analysis beyond the current consensus snapshot.
Additionally, we redesigned the BioPharma filters on the Explorer page to provide faster and easier access to the most important Screening filters. Users with an enterprise license can now export larger datasets to Excel for enhanced analysis.
As-of Date Analysis in Visible Alpha
Users can now select a historical As-of Date in Visible Alpha to view estimates and consensus as they existed on any specific date. The page refreshes to display actuals, estimates, and period labels relevant to the selected point in time. This enables users to see how street expectations have evolved and visualize revisions over time with Quick Charts. The calendar picker highlights earnings and revision dates, allowing users to quickly jump to significant events—such as earnings announcements or estimate changes—without manually searching through the calendar.
Find it in the platform:
Search for and select a company in the top search, e.g., NVIDIA Corporation
In the left-hand navigation menu, expand Visible Alpha
Use the As-of Date selector in the Period dropdown to choose a historical date
Use the highlighted earnings and revision dates in the picker to jump directly to a meaningful point in time
Use Quick Charts, including Trends and Revisions, to compare the historical consensus view against the latest estimates
Click Export in the top-right corner and select Export to Excel as Functions to generate a dynamic Excel model
Note: Access to Visible Alpha estimates data requires an additional subscription. Please contact your account team for details.
View Historical Estimates for Inactive Companies
Users can now access Visible Alpha data for companies where broker coverage has ended following an acquisition, delisting, or bankruptcy. This enhancement enables analysis of historical estimates and consensus for companies no longer covered by contributing analysts. Users can review how market expectations evolved throughout the company's coverage lifecycle by referencing key date shortcuts, including the earliest and latest estimate revisions, periods of peak broker coverage, and the most recent earnings announcement prior to coverage ending.
Find it in the platform:
Search for and select a company with inactive Visible Alpha coverage in the top search, e.g., Twitter, Inc.
In the left-hand navigation menu, expand Visible Alpha
Select Key Values or any page under Standardized Data or Company Data
Note the company status banner displayed at the top of the page, which indicates why coverage ended:
Inactive - Acquired
Inactive - Delisted
Inactive - Bankruptcy
Use the As-of Date selector in the Period dropdown to select a date prior to the end of coverage and view the consensus estimates available for that date
Click Export in the top-right corner and select Export to Excel as Functions to generate a dynamic Excel model
Note: Access to Visible Alpha estimates data requires an additional subscription, please contact your account team for details.
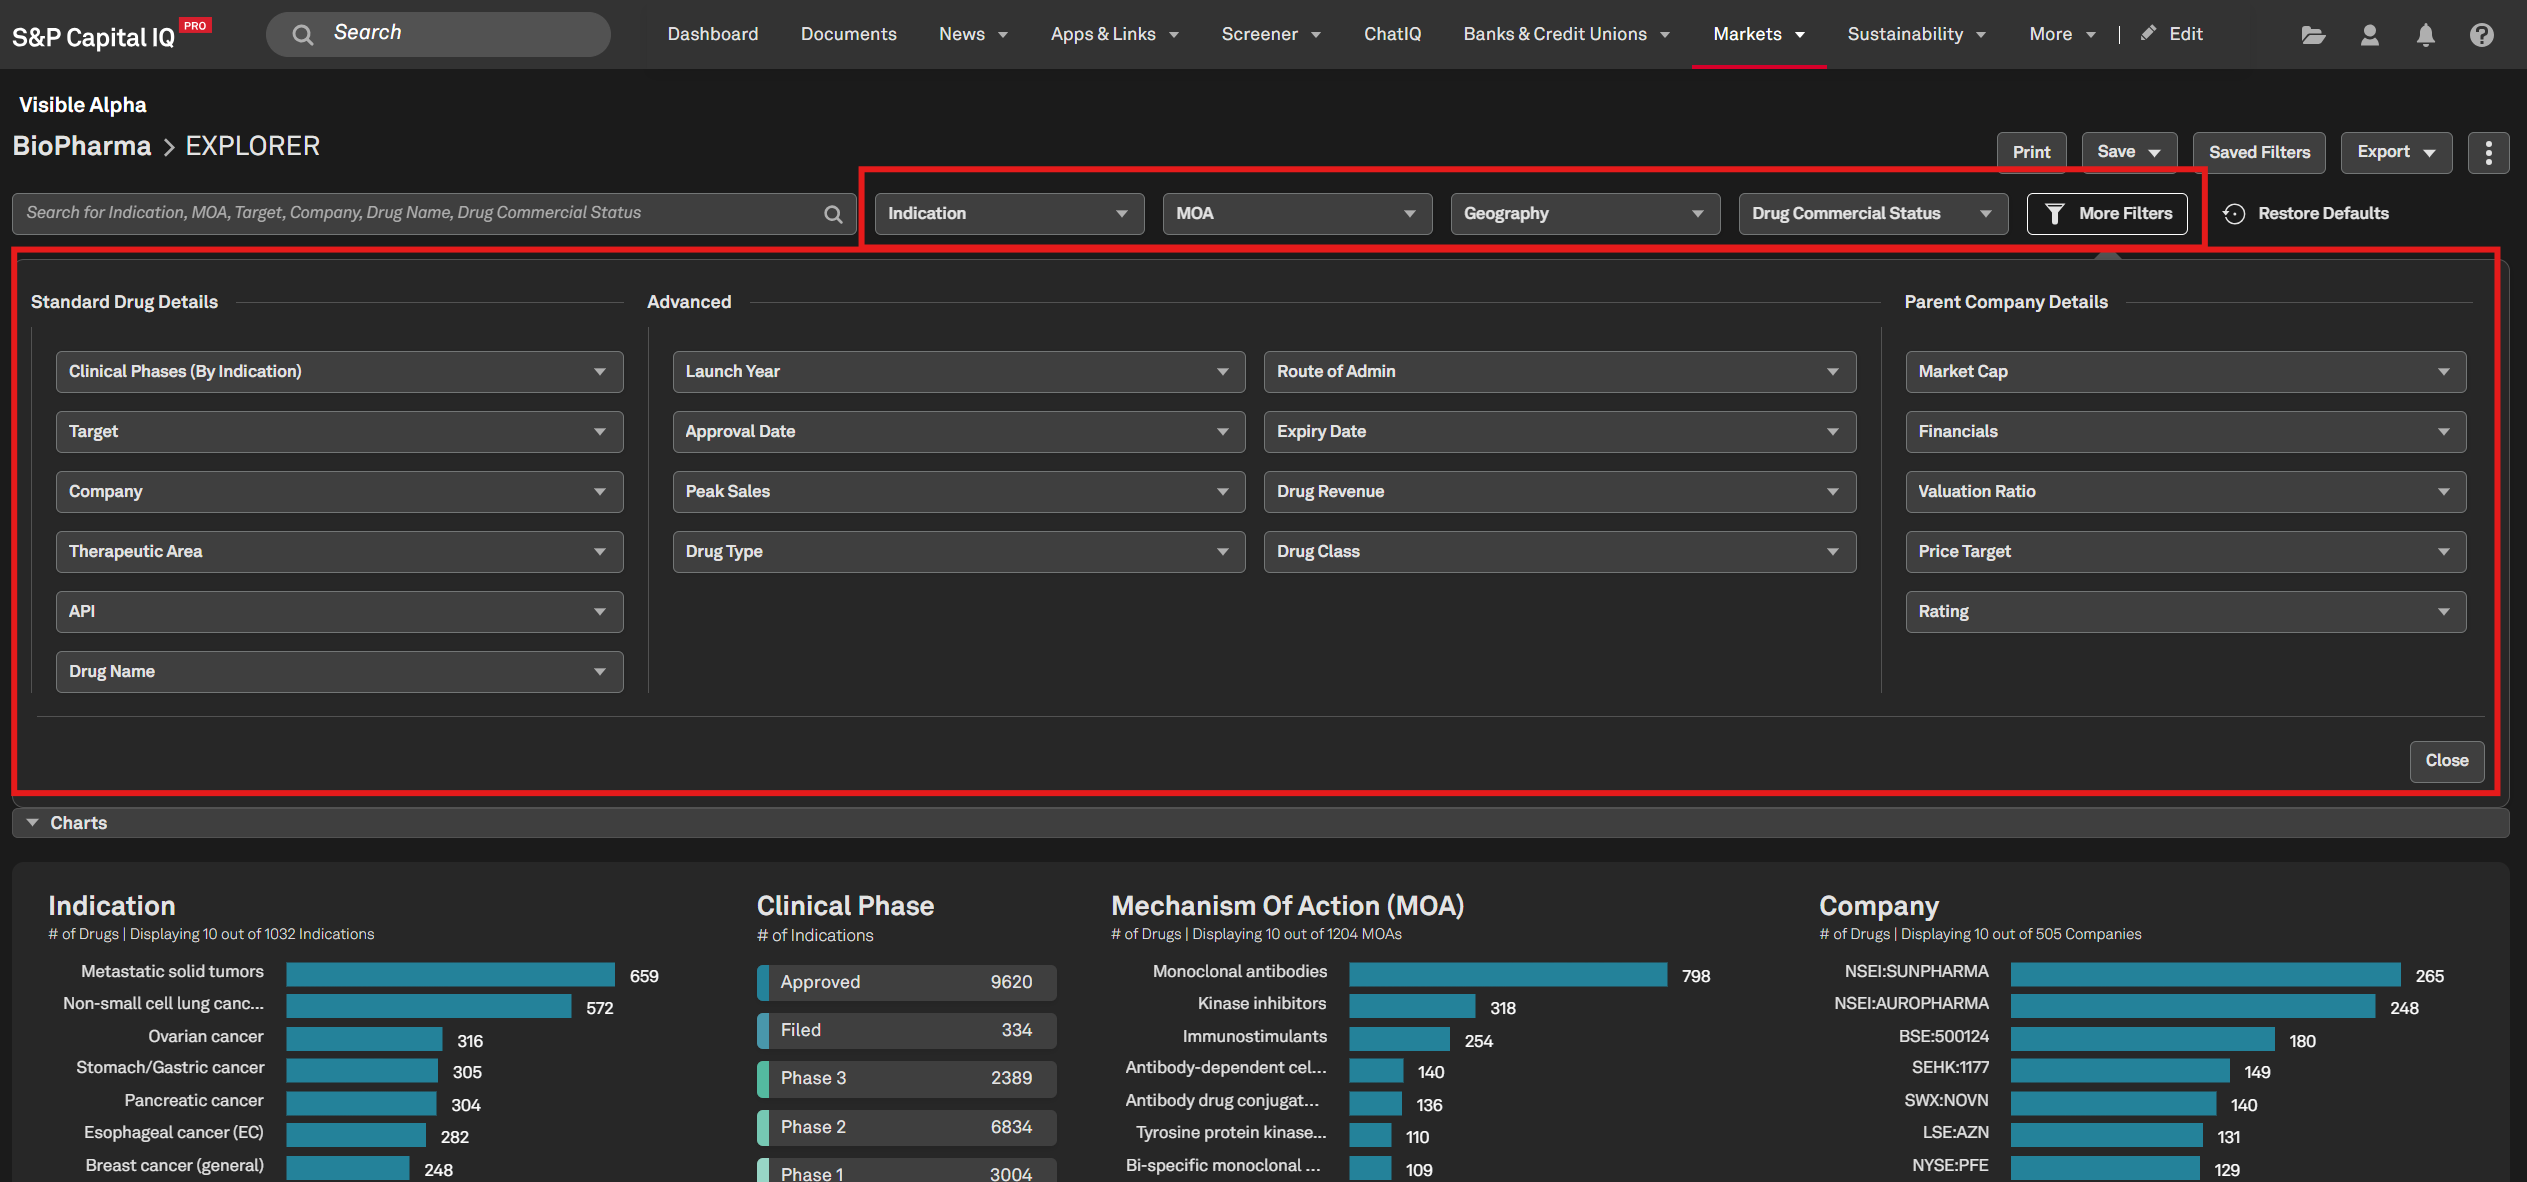
BioPharma Filter Redesign
Users can now easily access commonly used filters, such as Indication and MOA, directly on the Explorer page without needing to select ‘More Filters’. Filters are now logically grouped, and the redesigned menu provides a more streamlined and efficient filtering experience.
Find it in the platform:
Navigate to the Markets tab in the top navigation
Select BioPharma under Industries (for MI Industry users) or Sectors (for GICS users)
On the BioPharma Explorer page, view the Indication, MOA, Geography, and Drug Commercial Status filters to the right of the search bar
Click More Filters to see additional filter options
Note: Access to Visible Alpha BioPharma requires an additional subscription. Please contact your account team for details.
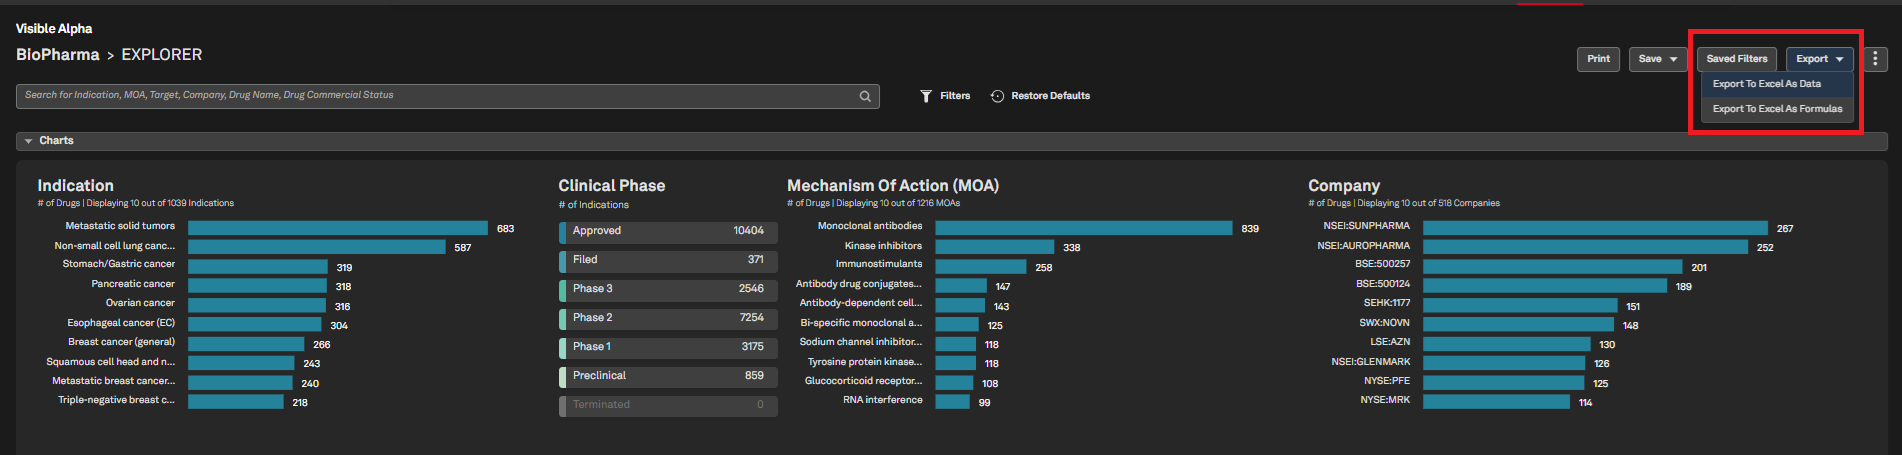
Export Limit Removal
Subscribed users can now export drug data from BioPharma without any export limits, enabling more comprehensive data analysis.
Find it in the platform:
Navigate to the Markets tab in the top navigation
Select BioPharma under Industries (for MI Industry users) or Sectors (for GICS users)
On the BioPharma Explorer page, search or use filters in the search bar to find the required drug
Select Export option at the top right and choose Export To Excel As Data or Export To Excel As Formulas
Users will see all drugs within their search available for export when export limits are removed
Note: Access to Visible Alpha BioPharma requires an additional subscription. Please contact your account team for details.
Investment Research
In this release, we introduced a dedicated Expert Networks contributor group, enabling users to easily identify, filter, and access research from expert networks. We also launched a new EXP research flag for real-time expert network content and enhanced contributor classification, search, alerts, and research settings workflows to support this new contributor category.
In addition, we enhanced the Research Settings on the S&P Capital IQ Pro platform by introducing configurable default research preferences. These settings provide a customized experience and help users focus on their preferred research sources and content types when accessing Investment Research.
Expert Networks Contributor Group
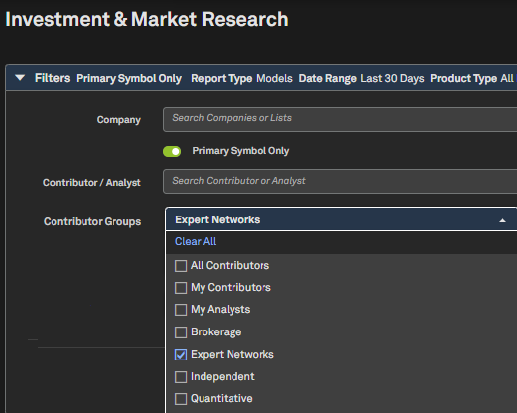
Users can now identify and filter research providers categorized as Expert Networks through a dedicated contributor group. Expert Networks are firms that connect users with industry experts to provide insights based on first-hand experience across industries, companies, and business functions.
The following contributors are currently classified as Expert Networks:
Third Bridge
AlphaSights
Blue Heron
Arbolus
Note: Expert Network documents will be available on the Capital IQ Pro platform starting the third week of September, and future Expert Networks contributors will be onboarded and classified within the Expert Networks contributor group.
Find it in the platform:
Navigate to the Research tab in the top navigation and select Investment & Market Research
In the Contributor Groups filter, select Expert Networks
View research and associated reports exclusively from Expert Networks
Note: Access to Investment Research requires an additional subscription. Please contact your account team for details.
Research Settings Enhancements
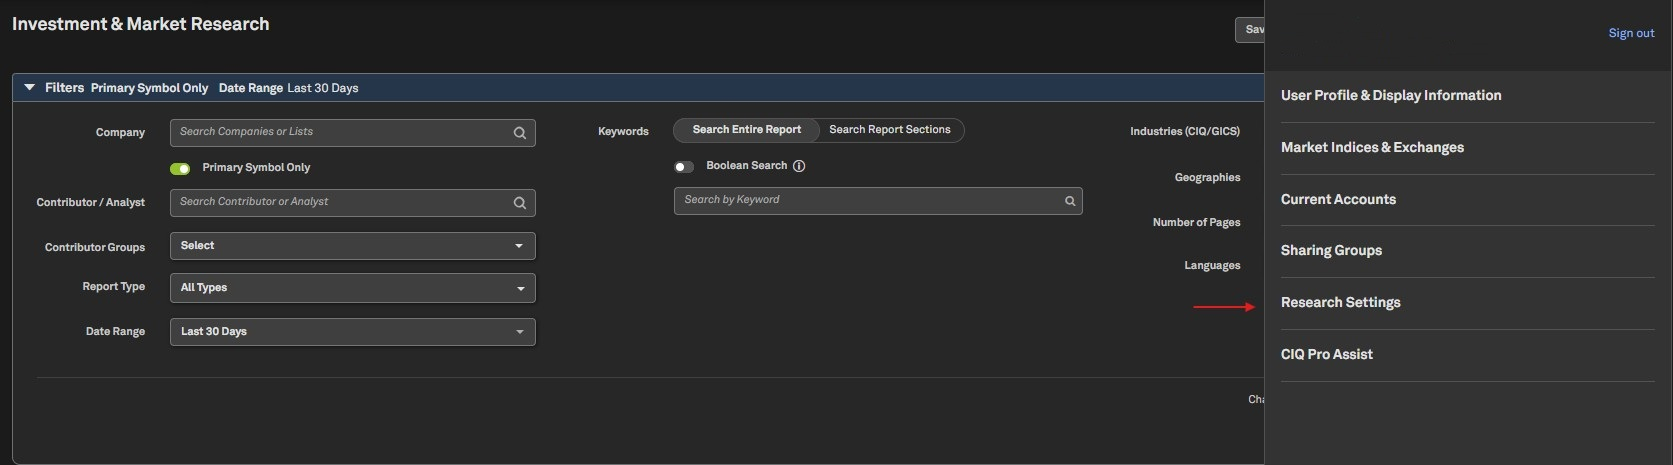
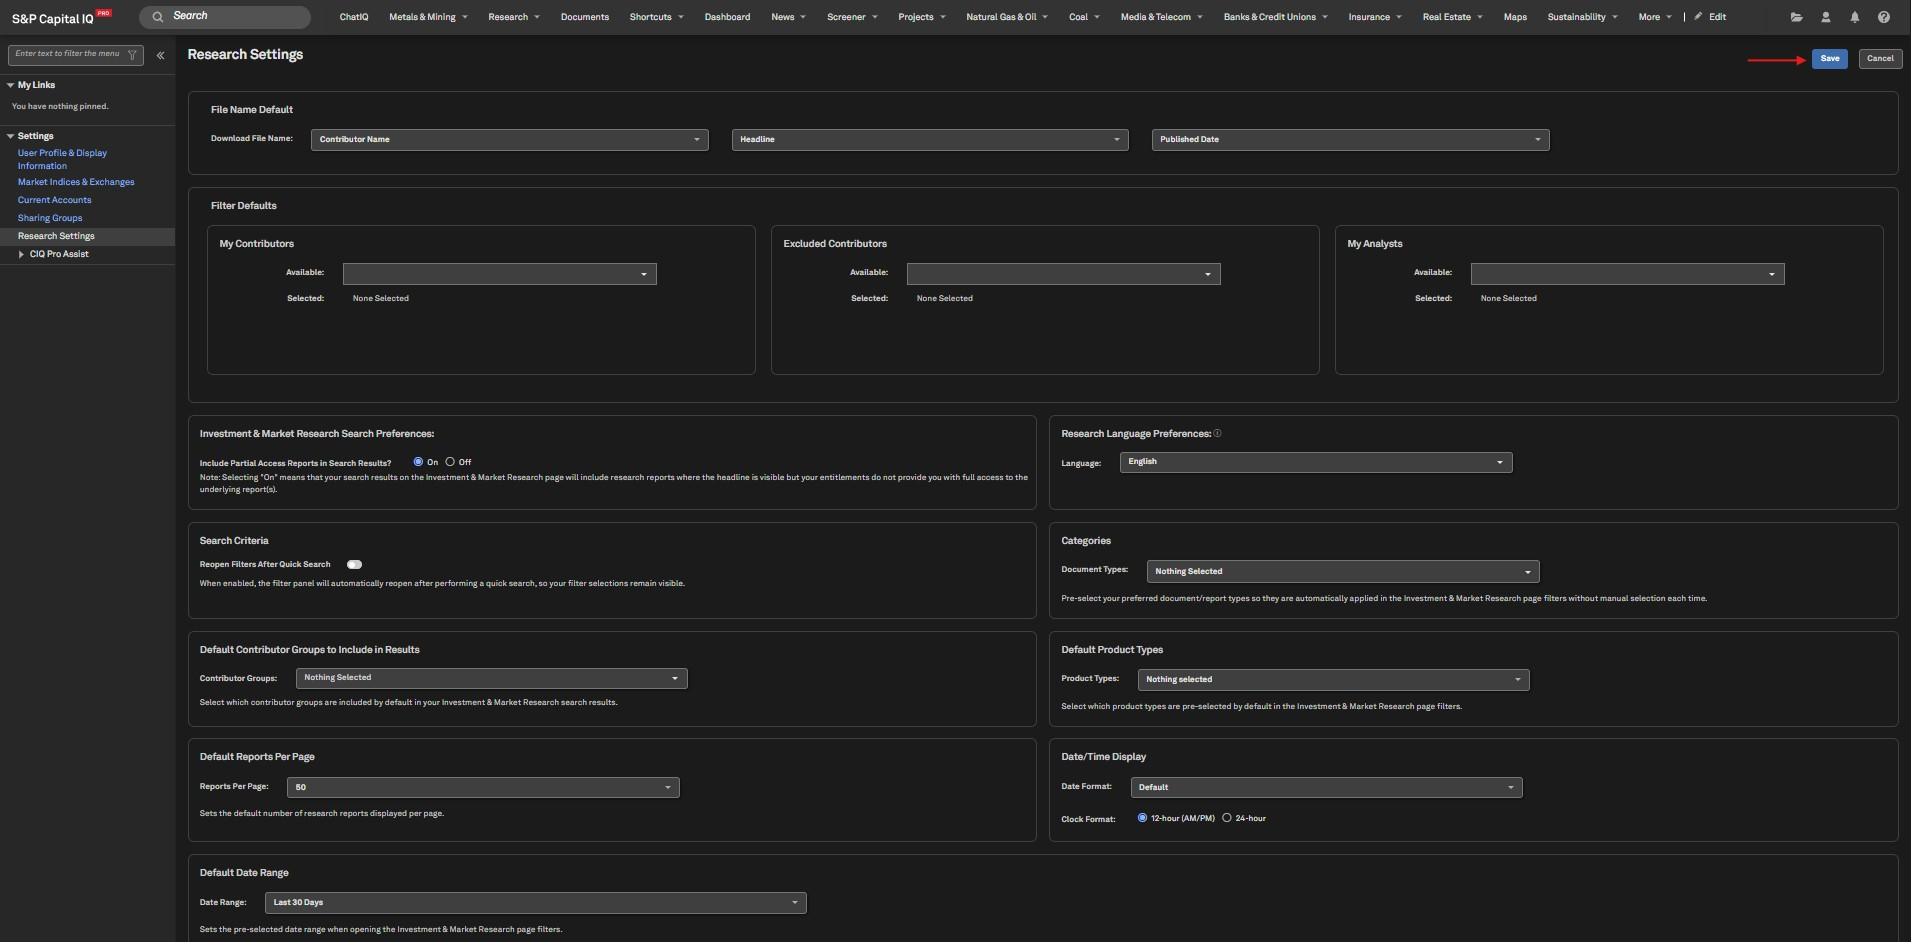
Users can now personalize their research experience by defining default contributor groups, date ranges, product types, document categories, date and time formats, and reports-per-page settings that are automatically applied when accessing Investment Research. Additionally, users can choose whether search filters remain open after quick searches, enabling a more streamlined workflow.
Find it in the platform:
Navigate to the profile icon on the right side of the top navigation and select Research Settings
Configure preferred settings and click on Save
Selected preferences will automatically apply to future research sessions
Corporate Profile
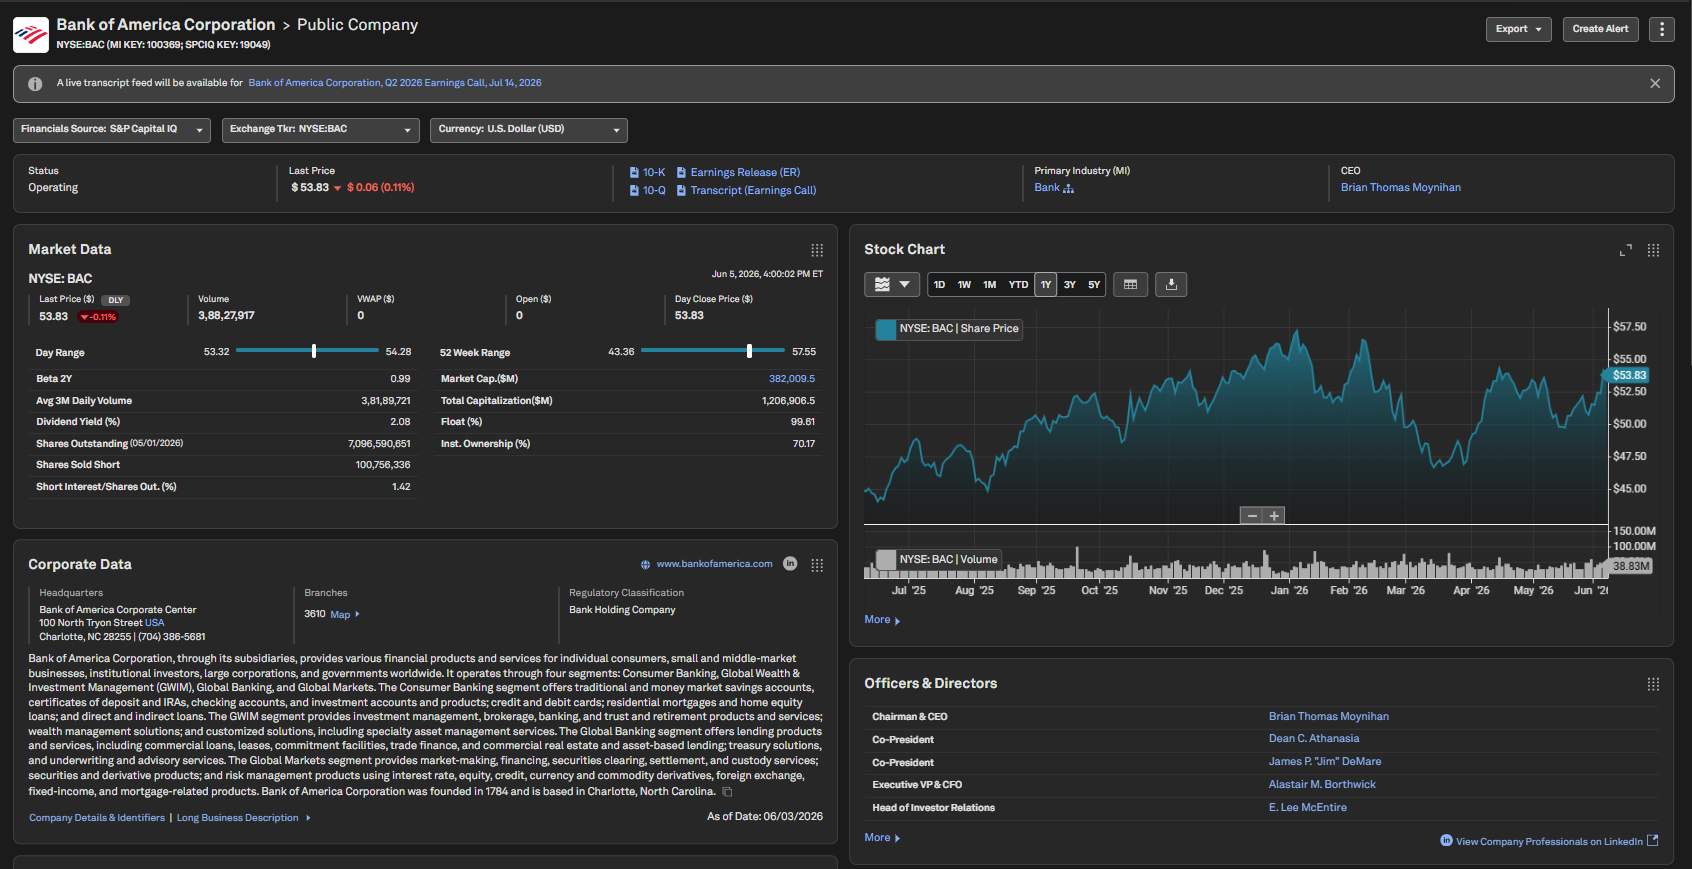
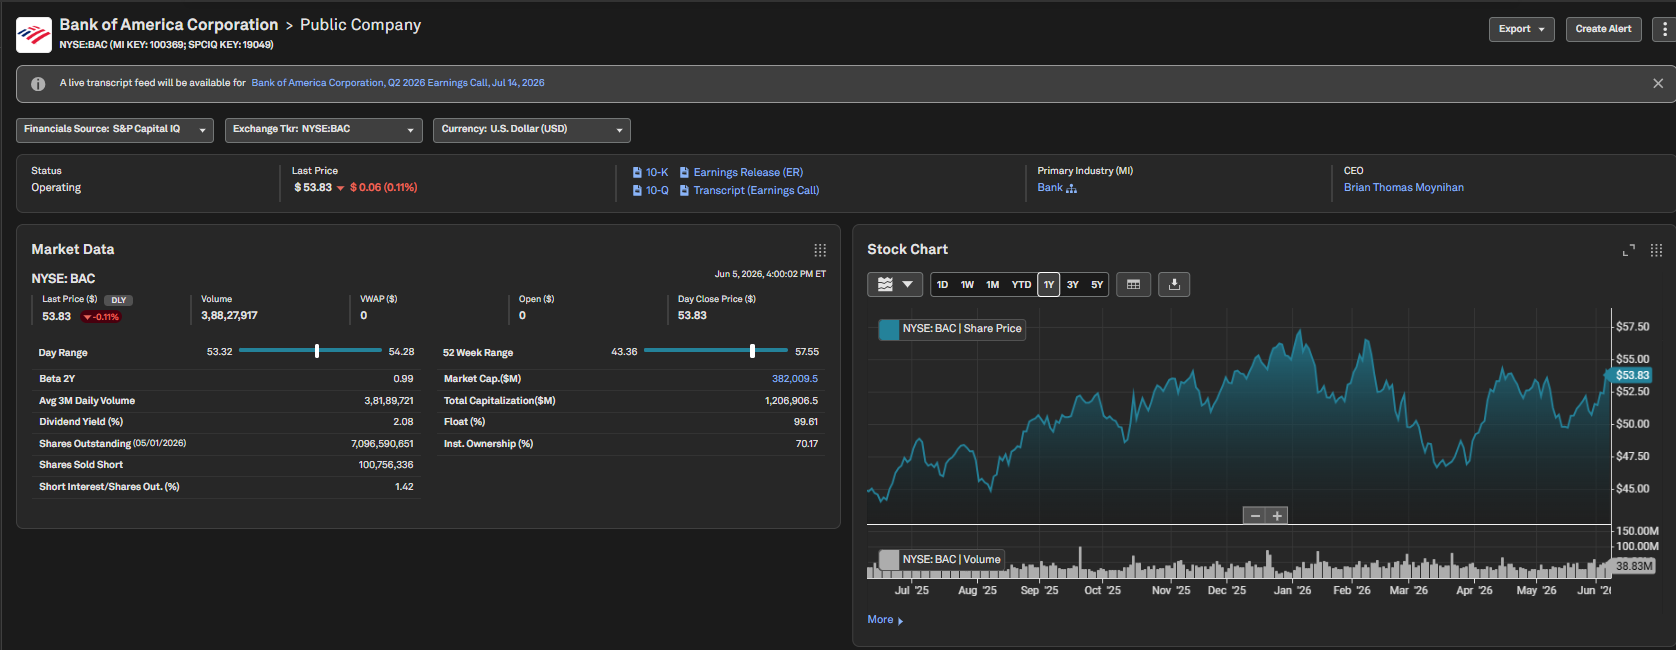
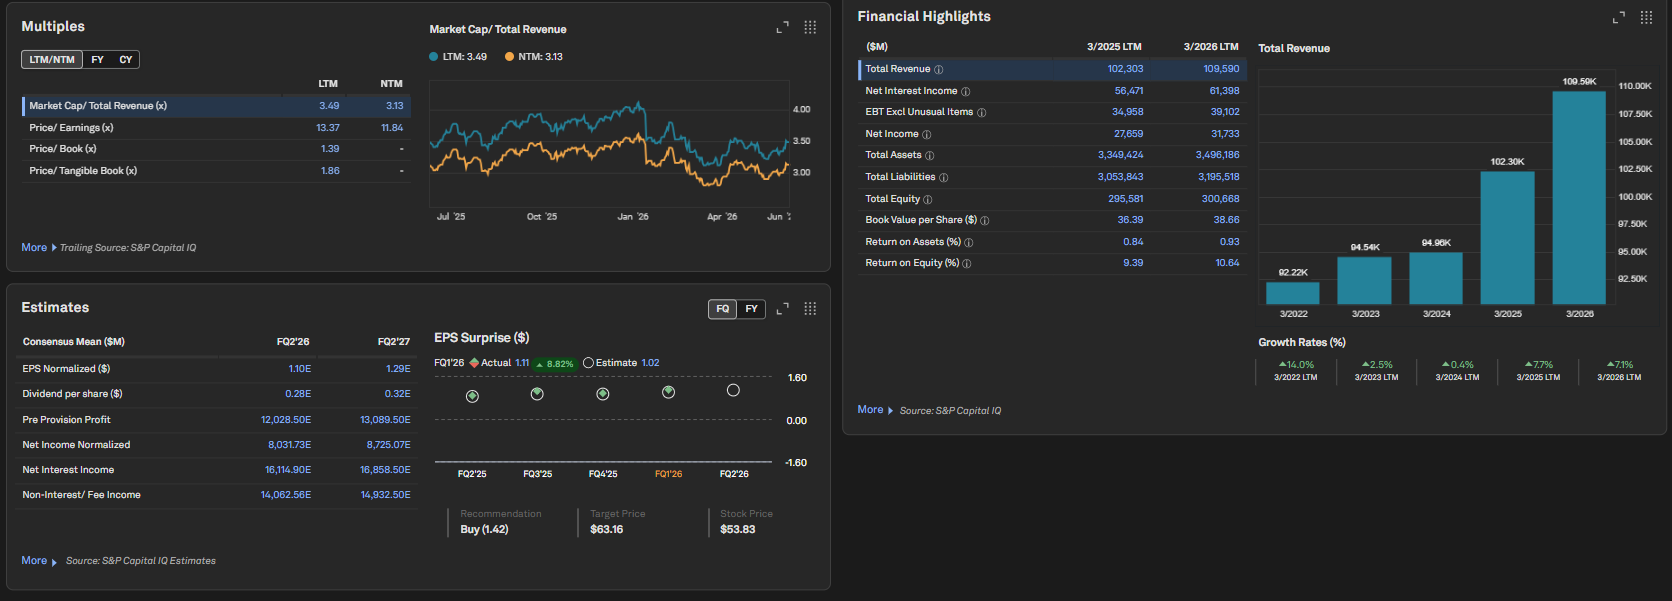
In this release, we introduced significant enhancements to the Corporate Profile page for public and private companies, offering a more personalized, intuitive, and data-rich experience for our users. The page features a customizable layout with default widgets, a dedicated customization panel for selecting required datasets, expandable charts for detailed analysis and the option to restore default configurations. Additionally, widgets for Market Data, Multiples, Financial Highlights, Estimates, and Corporate Data are enhanced with improved visualizations, better data organization, and new analytical capabilities.
Customizable Corporate Profile
Users can now customize the Corporate Profile for both public and private companies. The page features preselected default widgets for instant access to frequently used data, while a customization panel enables users to select a display relevant to them. Users can rearrange widgets to their preferences, restore default configurations with a single click, and expand chart-based widgets for more detailed, in-depth analysis. All customization preferences are automatically saved and persist across sessions.
Find it in the platform:
Search for and select a company in the top search to navigate to its Corporate Profile
The public company page displays 9 pre-selected default widgets optimized for common workflows
The private company page displays all the widgets by default
View Customize your View panel at the bottom or in the Settings menu
Toggle widgets on or off to display only required data
Click the expand icon on chart-based widgets to view them on full screen
Drag and drop widgets to rearrange the layout as needed
Click Restore Defaults to reset to the default configuration

Enhanced Widget Functionality
In this release, we enhanced 5 widgets with additional data and better visual displays:
Market Data and Stock Price widgets now include real-time pricing
Multiples widget presents trailing and forward multiples in a unified view, integrating charting from ChartIQ for a more visual presentation of a trend analysis
Financial Highlights widget consolidates key insights across sources, with an expanded data grid that displays 5 years of data and growth-rate analysis
Estimates widget features EPS surprise charts and industry metrics
Corporate Data widget provides a structured layout with easy access to company identifiers
Industry classification identifiers and the detailed Industry tree are consolidated in a pop-up under the 'Primary Industry' section for quick access to industry-related information
Find it in the platform:
Search for and select a public company in the top search to navigate to its Corporate Profile
View the Market Data and Stock Price widgets for real-time pricing data
Check the Multiples widget for unified trailing and forward multiples
View the Financial Highlights widget with twelve months of key metrics and growth-rate analysis
View the Estimates widget with EPS Surprise charts and industry-aligned consensus data
Access the Corporate Data widget with improved layout, along with the Company Details & Identifiers section displaying Alternate & Historic Names of the company
Note: Access to real-time pricing requires an additional subscription, please contact your account team for details.
Private Markets & Private Company
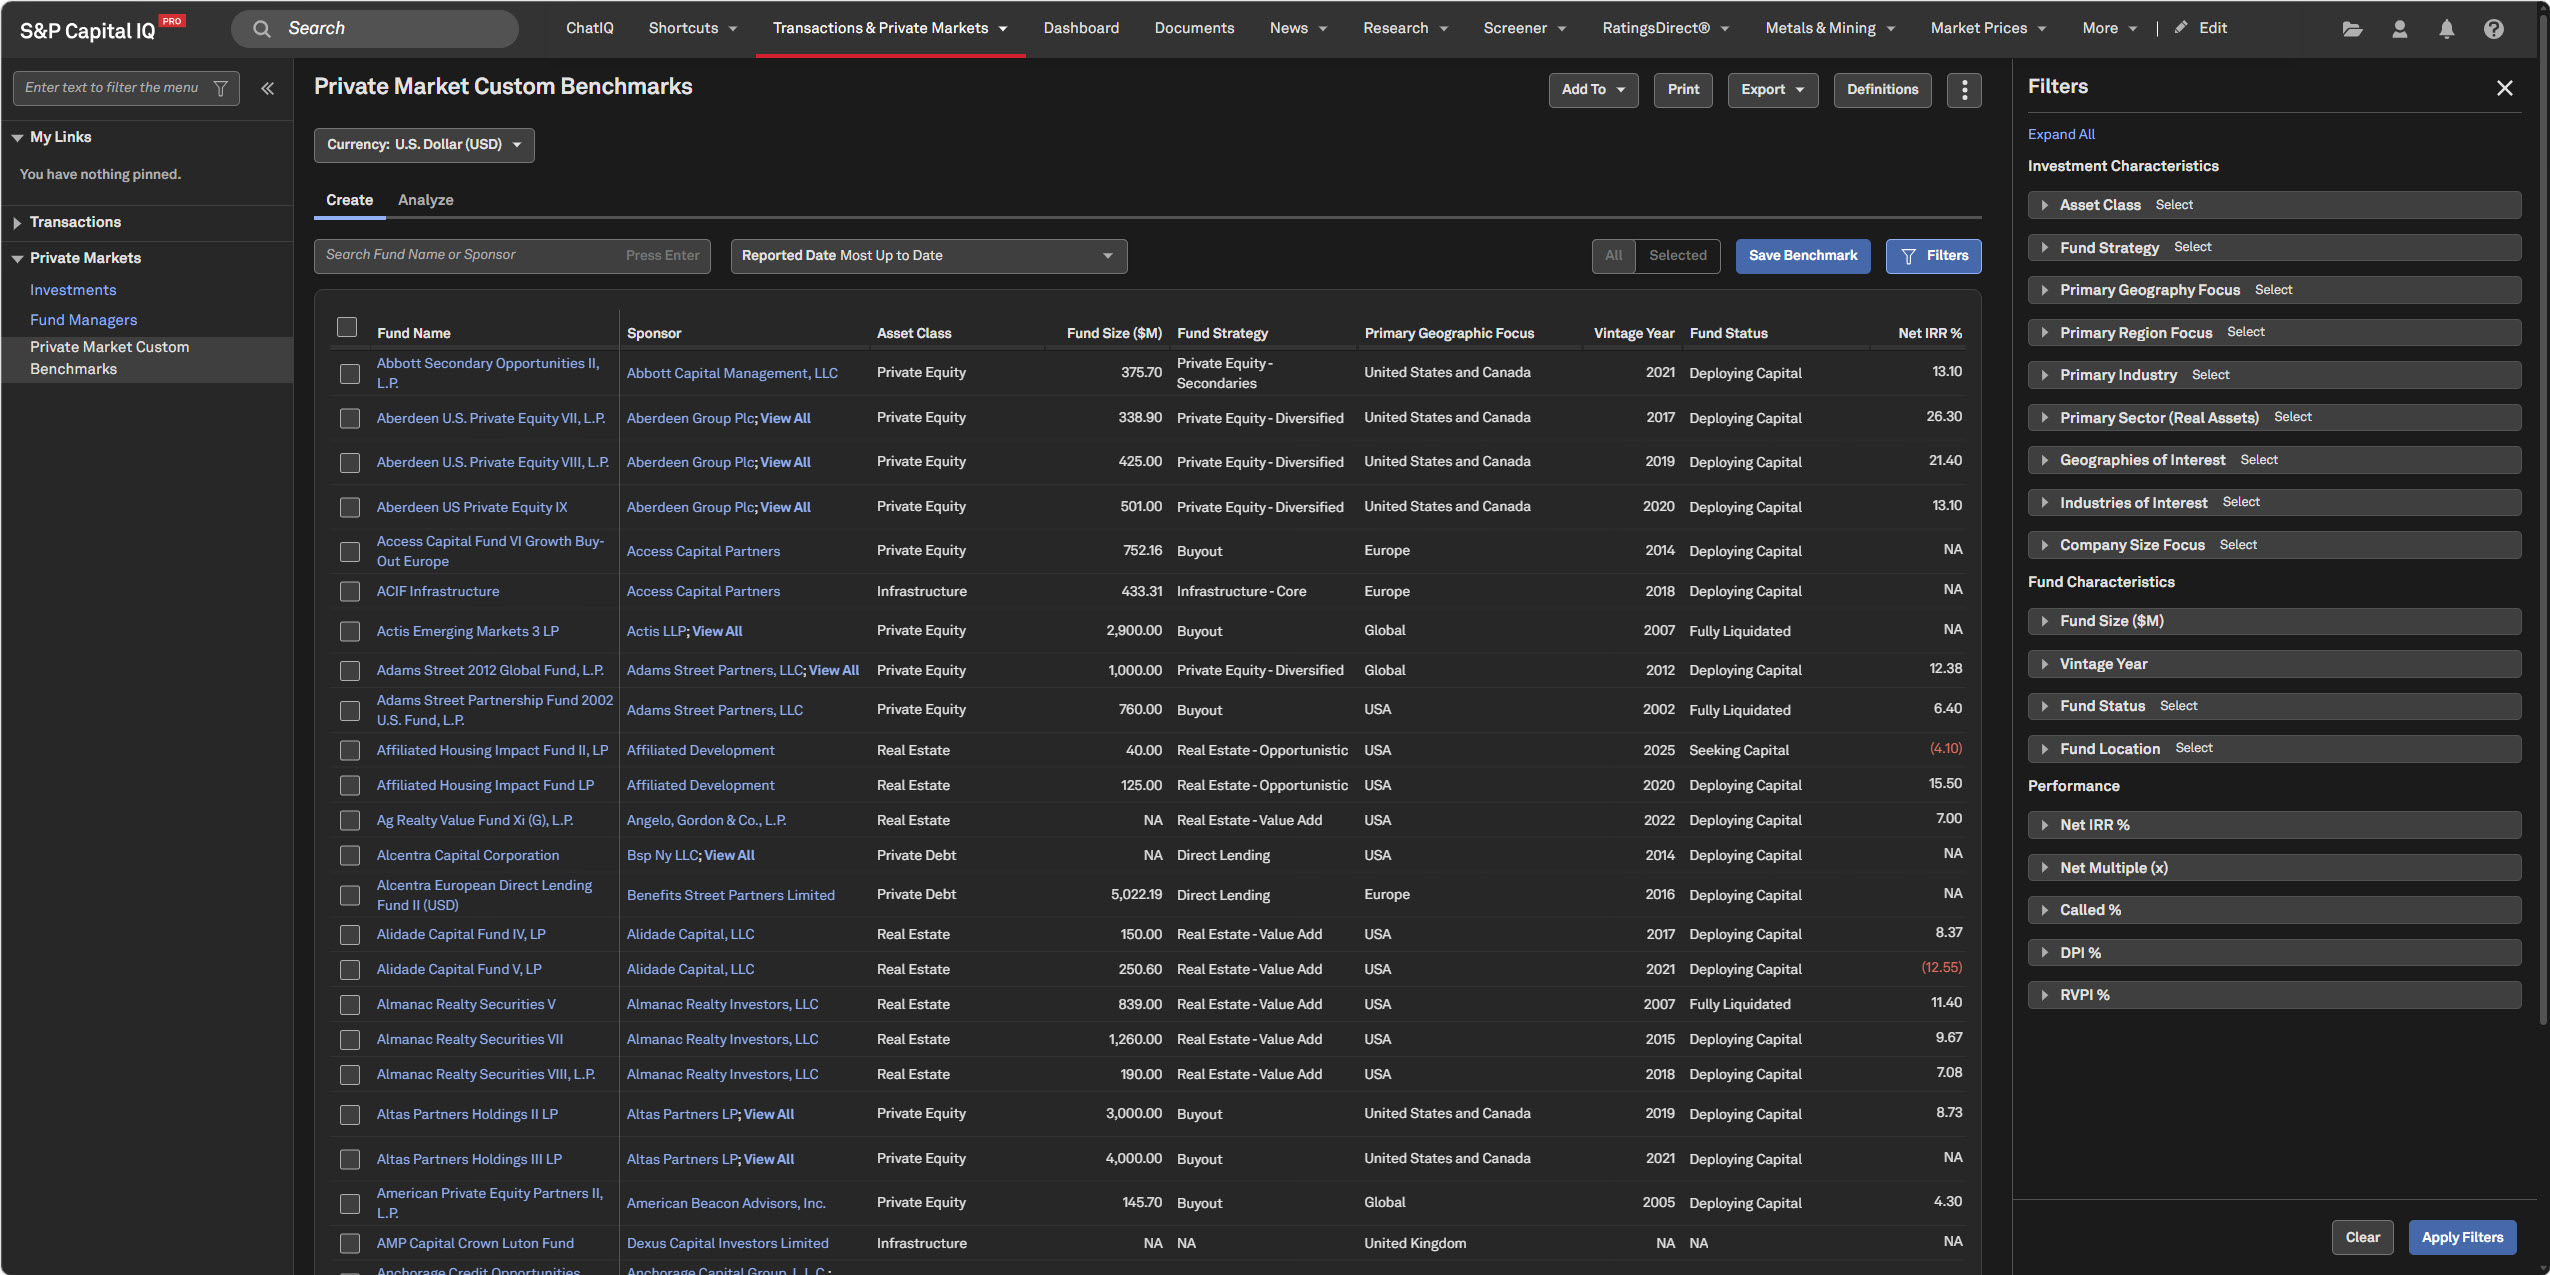
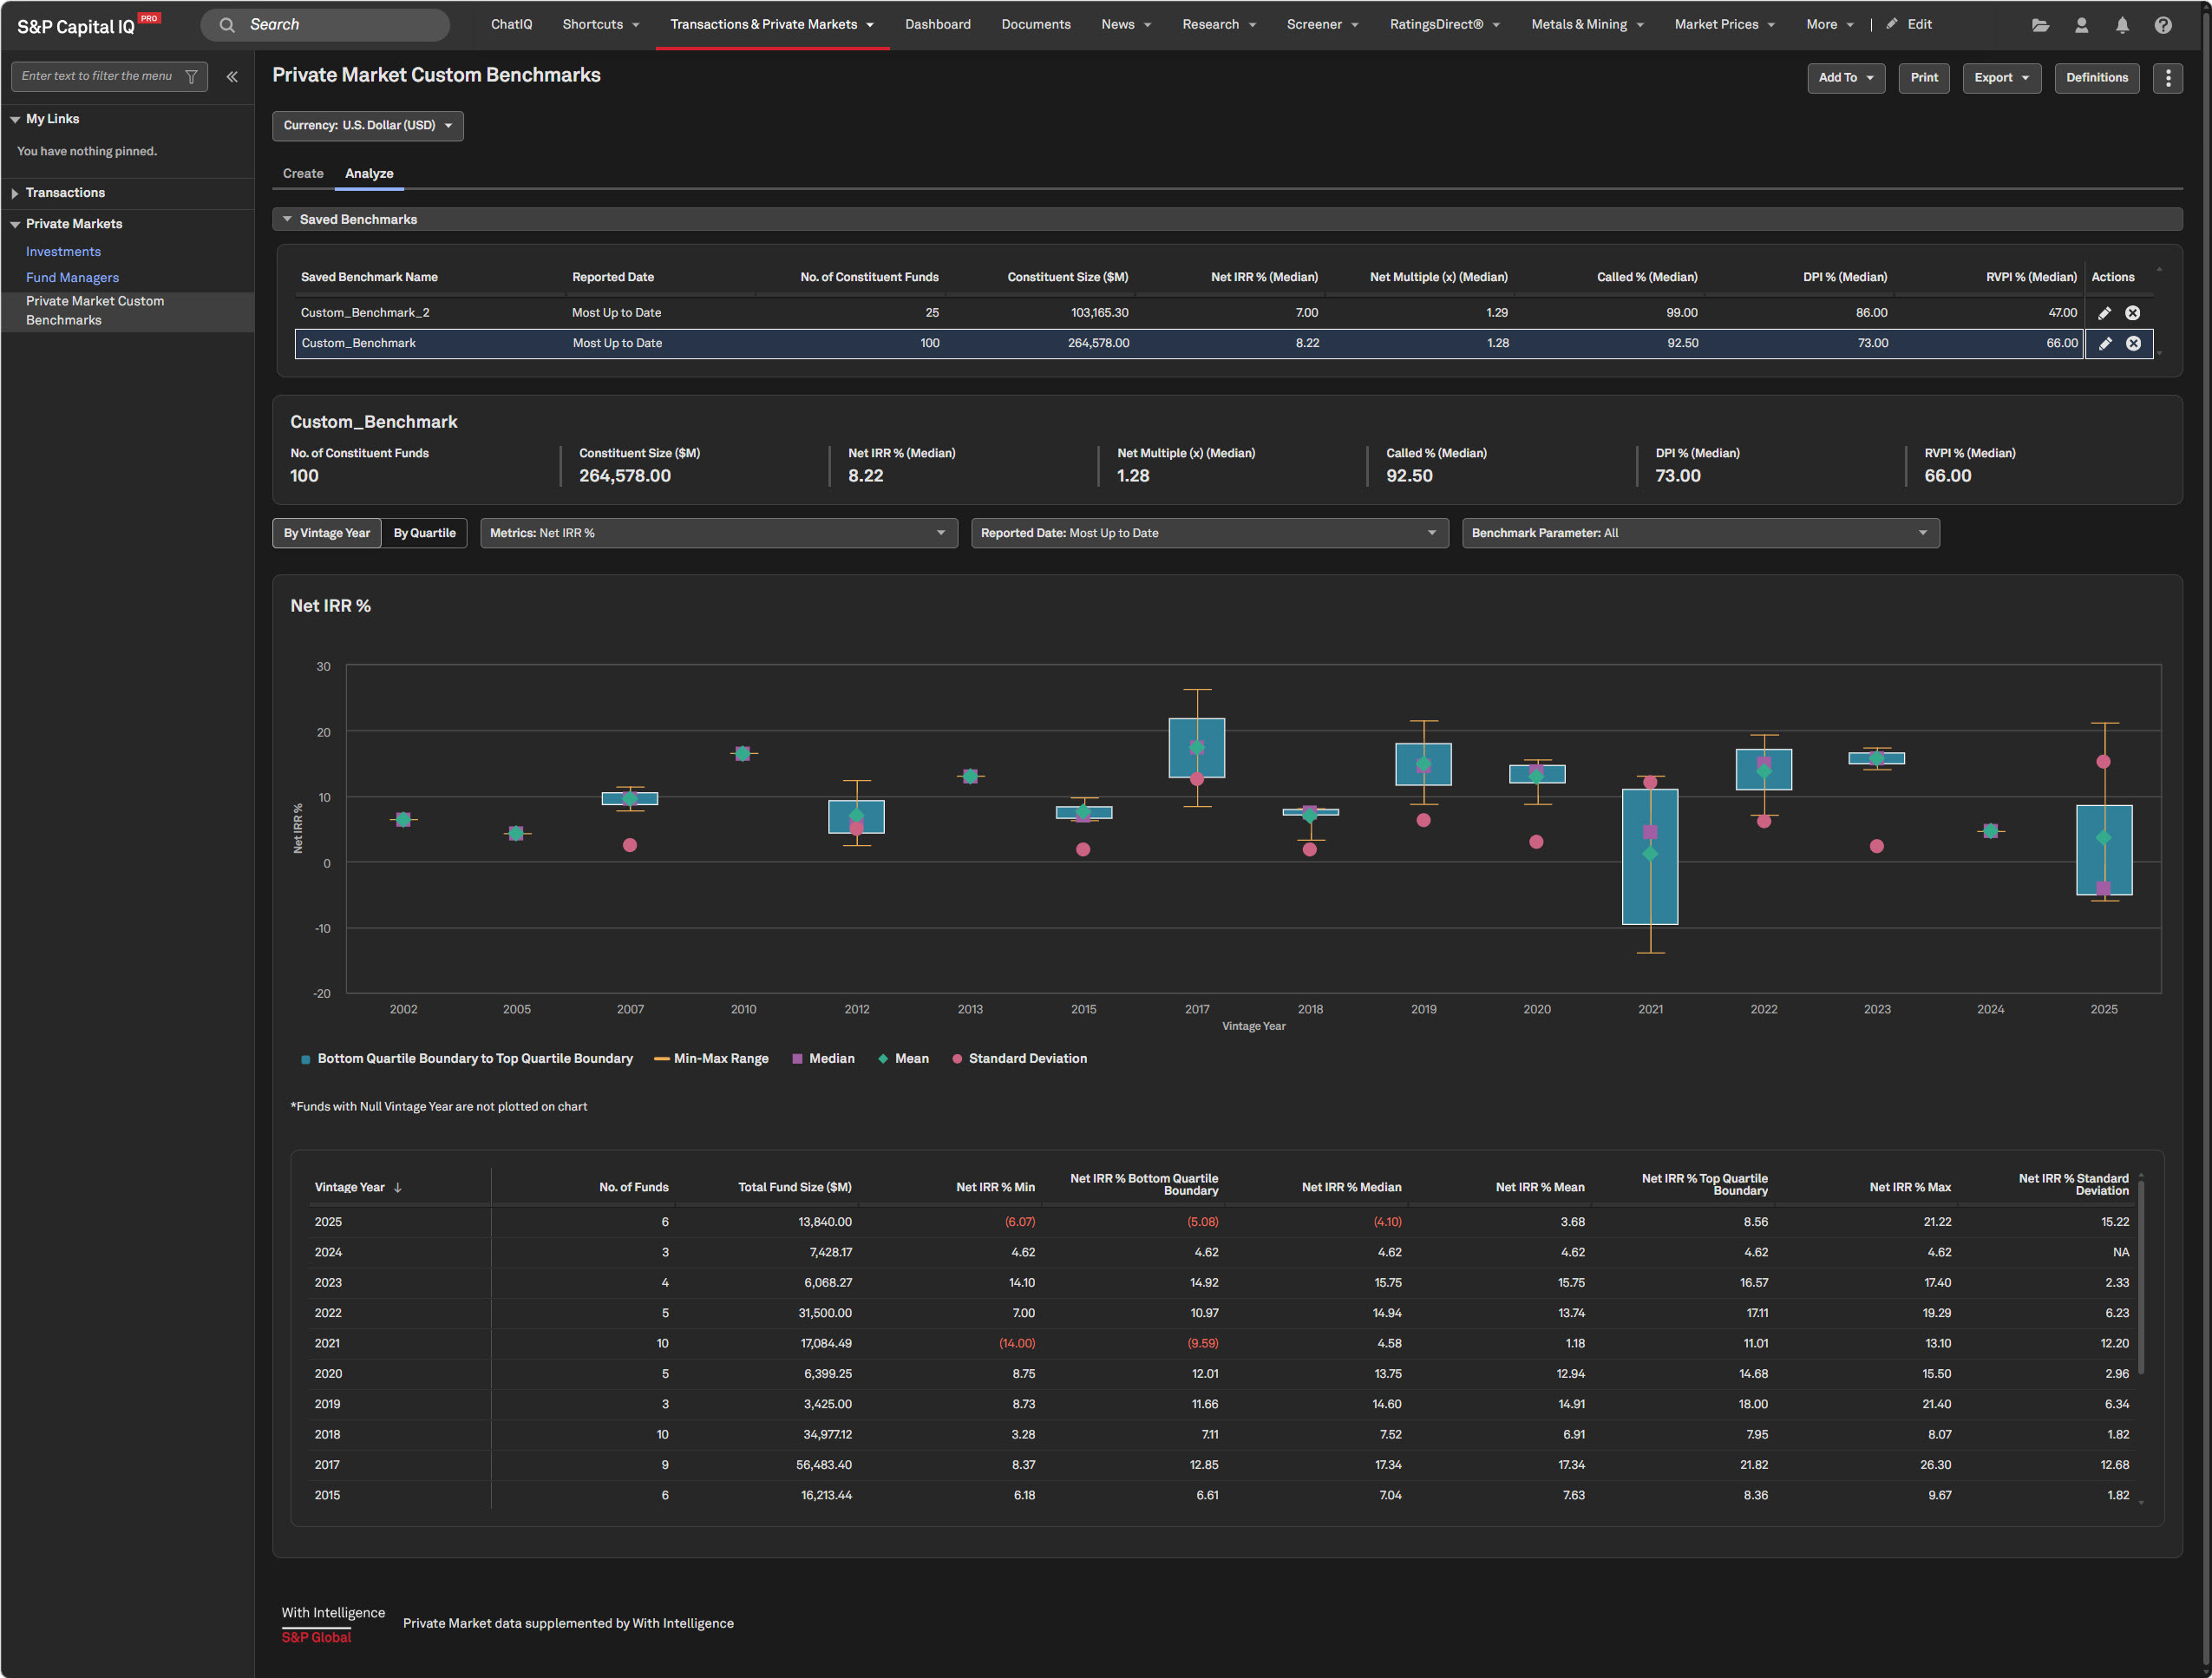
In this release, With Intelligence users can use a custom private markets benchmarking tool to build tailored benchmarks based on fund-level criteria and compare fund performance using key metrics, enhancing the accuracy of peer benchmarking and decision-making. Additionally, we added 17 new screening criteria for investment firms and funds in Screener and the S&P Capital IQ Pro Plug-in for more precise targeting and analysis. We also enriched private company profiles by adding 10 new topic tags and over 400K company logos, improving discoverability. Furthermore, our private company data coverage for Austria now includes additional firmographics, financials, and officers & directors data for small and medium enterprises.
New Private Market Custom Benchmarking Tool
With Intelligence subscription users can create tailored private market benchmarks using fund-level criteria such as strategy, geography, industry focus, vintage, size, etc. - aligned to the firm’s investment strategies and portfolio analysis needs. This enables users to analyze performance dispersion, compare selected funds to the benchmark peer sets, and assess quartile placement using key metrics such as IRR %, Net Multiple (x), DPI %, RVPI %, and Called %.
Find it in the platform:
Navigate to Transactions & Private Markets in the top navigation
Create a benchmark using Fund Filters and Fund Selection criteria
Save benchmarks for future analysis
Access benchmark performance analysis through the Analyze view
Note: Access to Private Market Custom Benchmarks requires an additional With Intelligence subscription. Please contact your account team for details.
New Private Fund Criteria in Screener & S&P Capital IQ Pro Plug-in
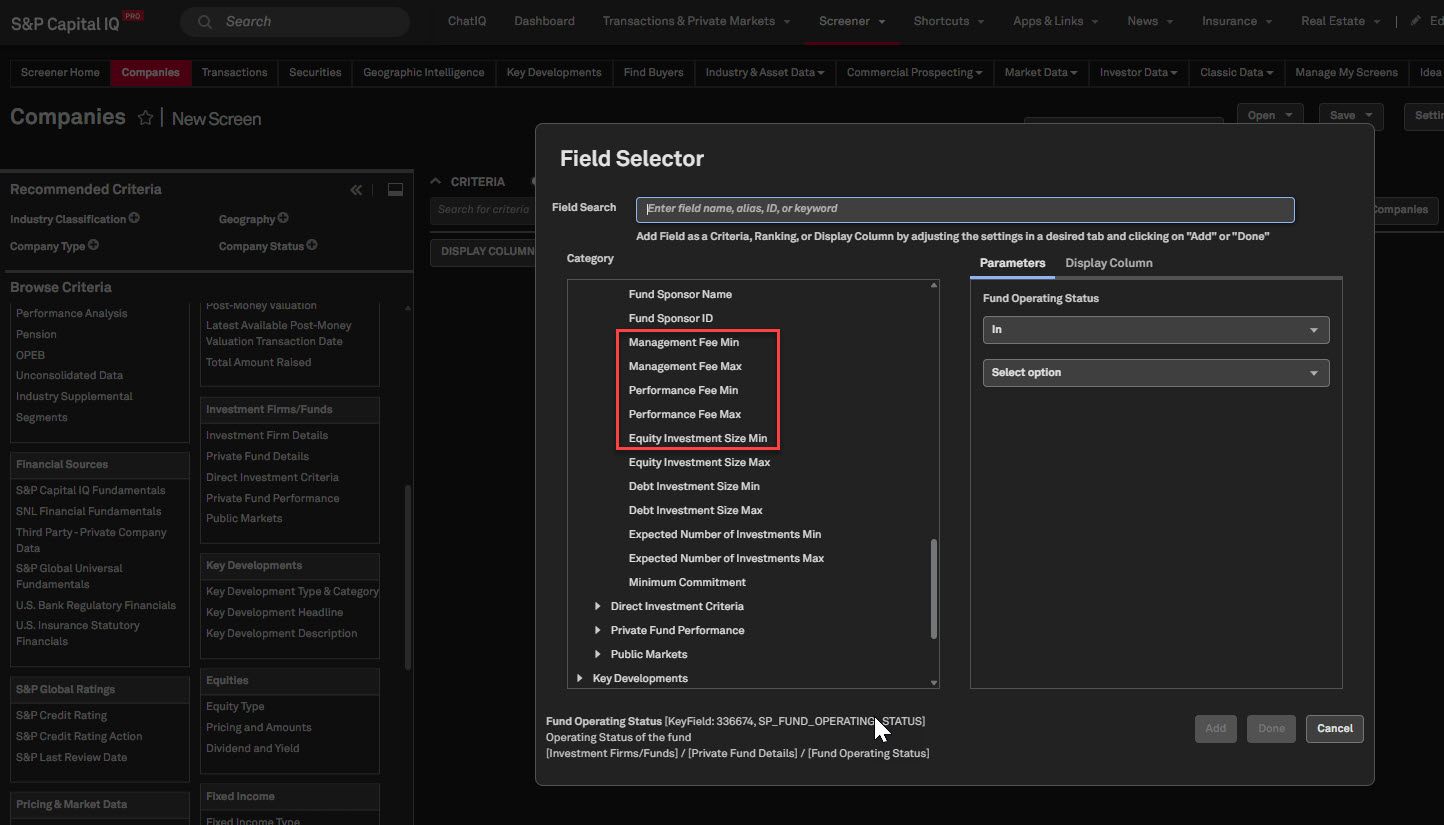
Users can enhance their investment firm and private fund screens with 17 new criteria, enabling more targeted analysis using key data attributes such as Management Fee, Performance Fee, Minimum Commitment, Company Size Focus, Primary Sector, Secondary Sector, Market Focus, Duration, and more. These additions are also available via the S&P Capital IQ Pro Plug-in.
Find it in the platform:
Screener
Navigate to Screener from the top navigation or the Apps & Links menu and select Companies Screener
Under Browse Criteria or Display Columns, select Investment Firms/Funds > Private Markets > Private Fund Details to access the new criteria fields
S&P Capital IQ Pro Plug-In
In Excel, launch the S&P Capital IQ Pro Plug-in and open Formula Builder
In the Companies workflow, select Investment Firms/Funds > Private Markets > Private Fund Details to access the new criteria fields
Private Companies Logos
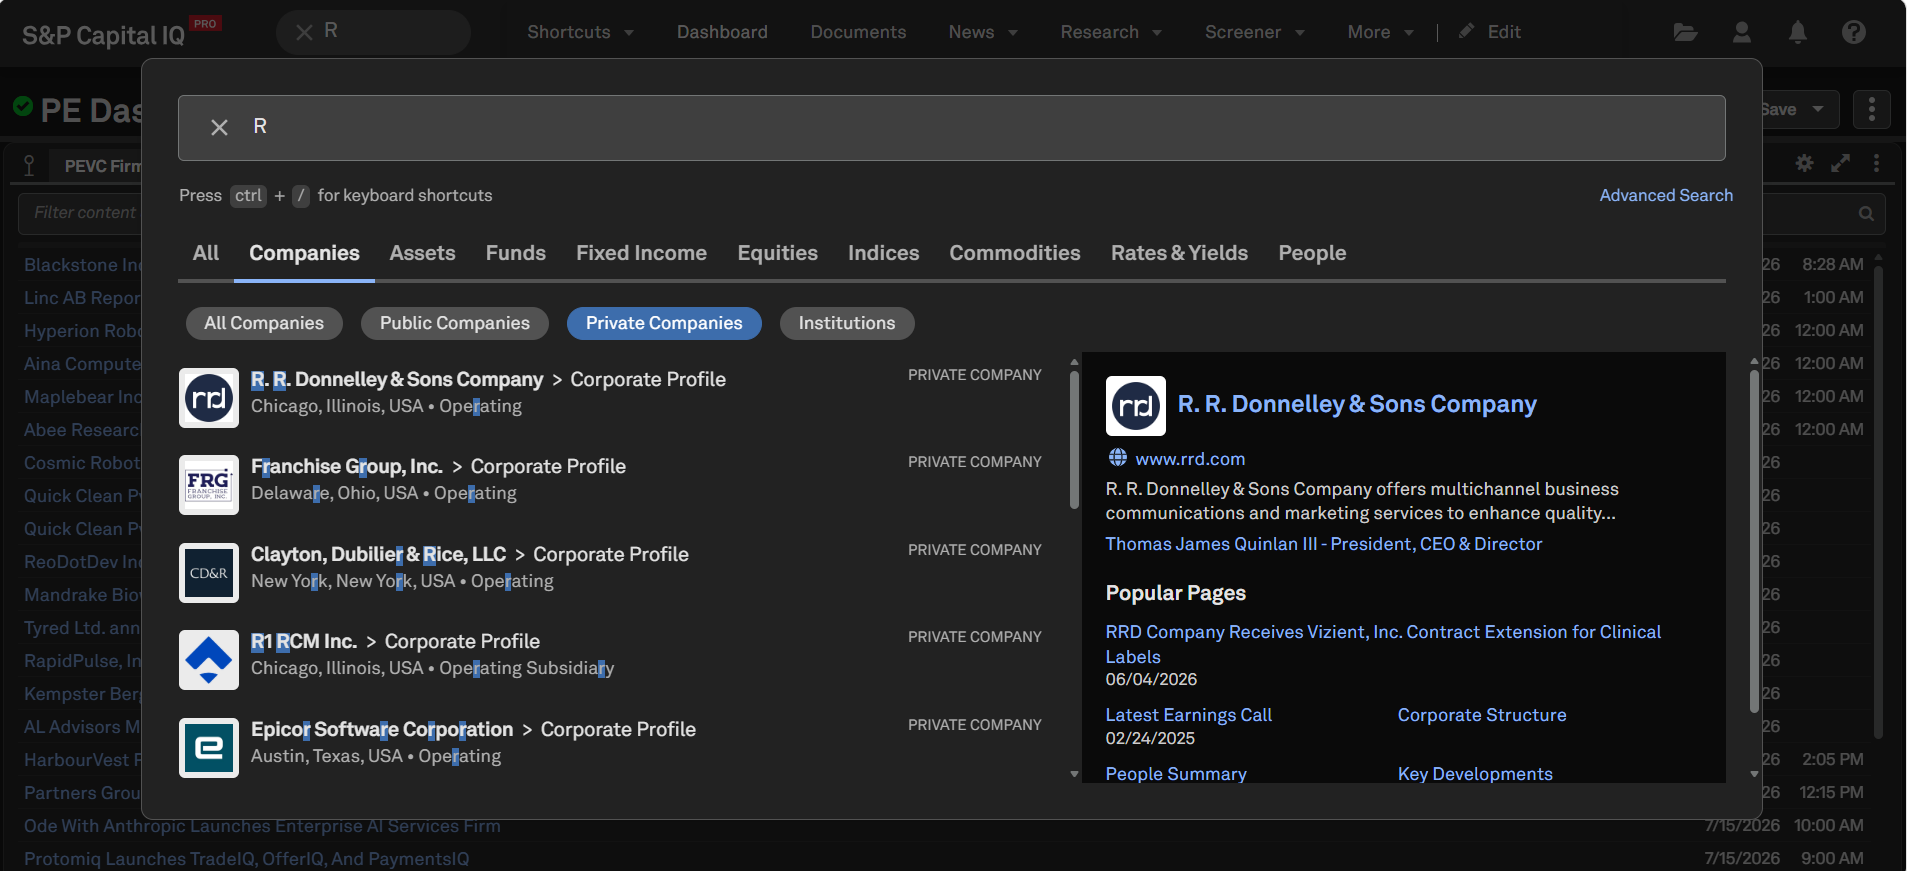
Users can benefit from expanded private company logo coverage, with over 400K additional logos accessible through the Search and People Summary pages.
Find it in the platform:
Search for a private company in the top search
View the company logo displayed alongside the company name
The logo also appears on the company card within the search results, making it easier to identify companies at a glance
Navigate to the company’s Corporate Profile, where the logo is shown alongside the company name in the header
On the company’s People Summary page, the logo is displayed in the header
Coverage stats:
400K+ private companies
New Metals & Mining, AI, and Tech Topic Tags
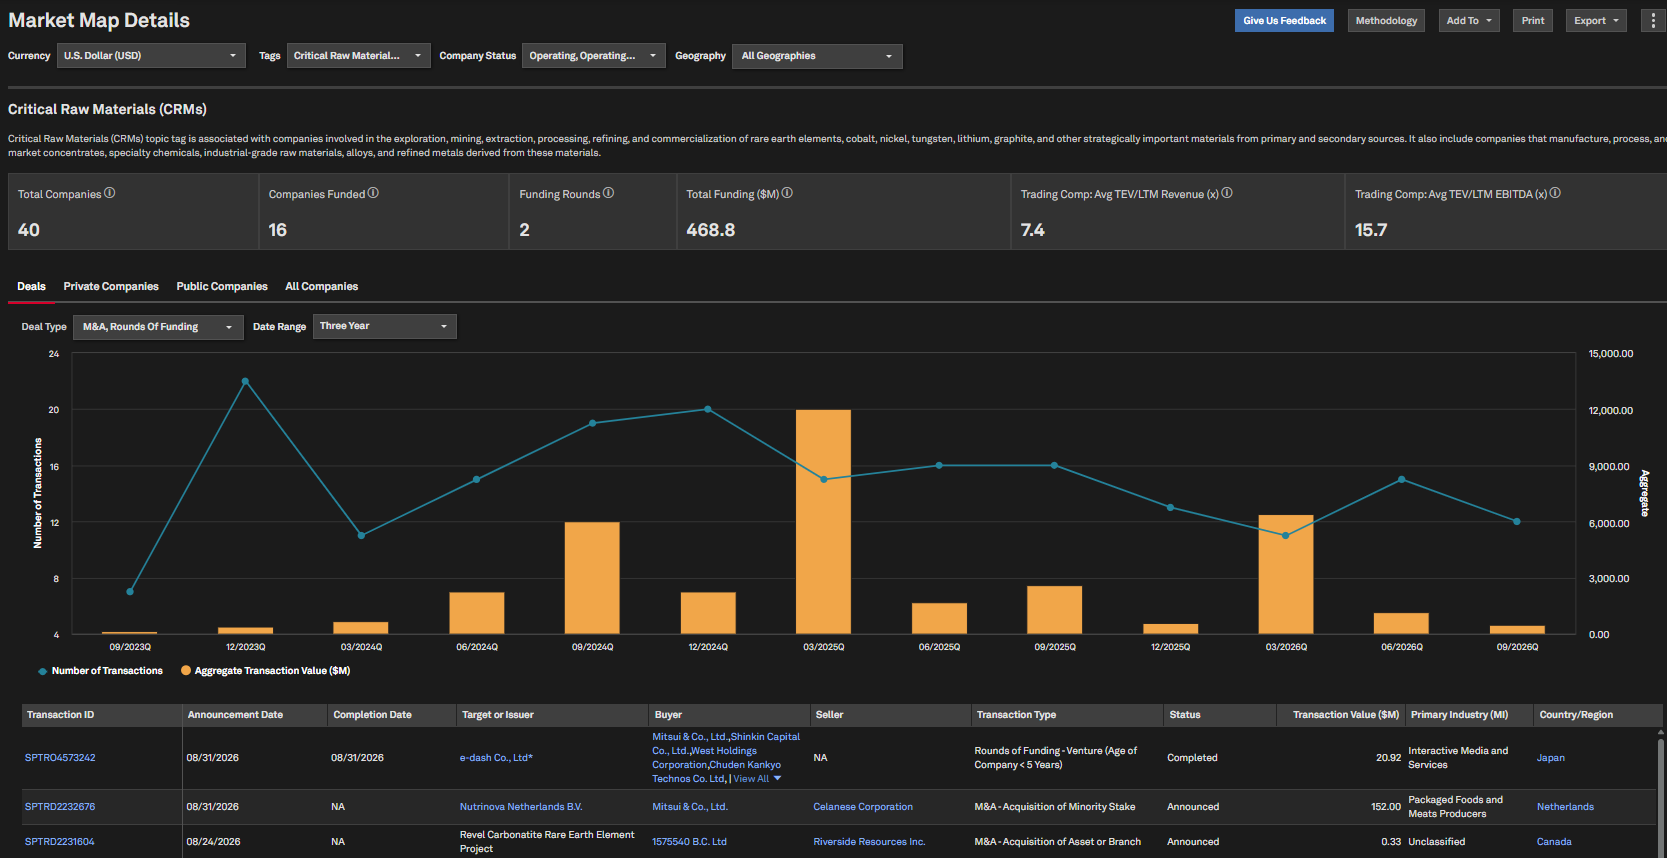
Users can access 10 new Topic Tags - Critical Raw Materials (CRMs); Light Rare Earth Elements (LREEs); Heavy Rare Earth Elements (HREEs); Mining Drilling Services; Vertical Software as a Service (SaaS); Enterprise Software as a Service (SaaS); Software Consulting and Engineering; AI Frontier Labs; AI Developer Tools; AI Generative Media - via the Market Maps and Profiles pages, allowing users to identify companies that operate in these niche markets to support the deal sourcing workflow.
Find it in the platform:
Navigate to the Markets tab from the top navigation menu
Select Market Maps and choose a Topic Tag to deep dive into relevant companies, deal activity, and latest news within this niche market
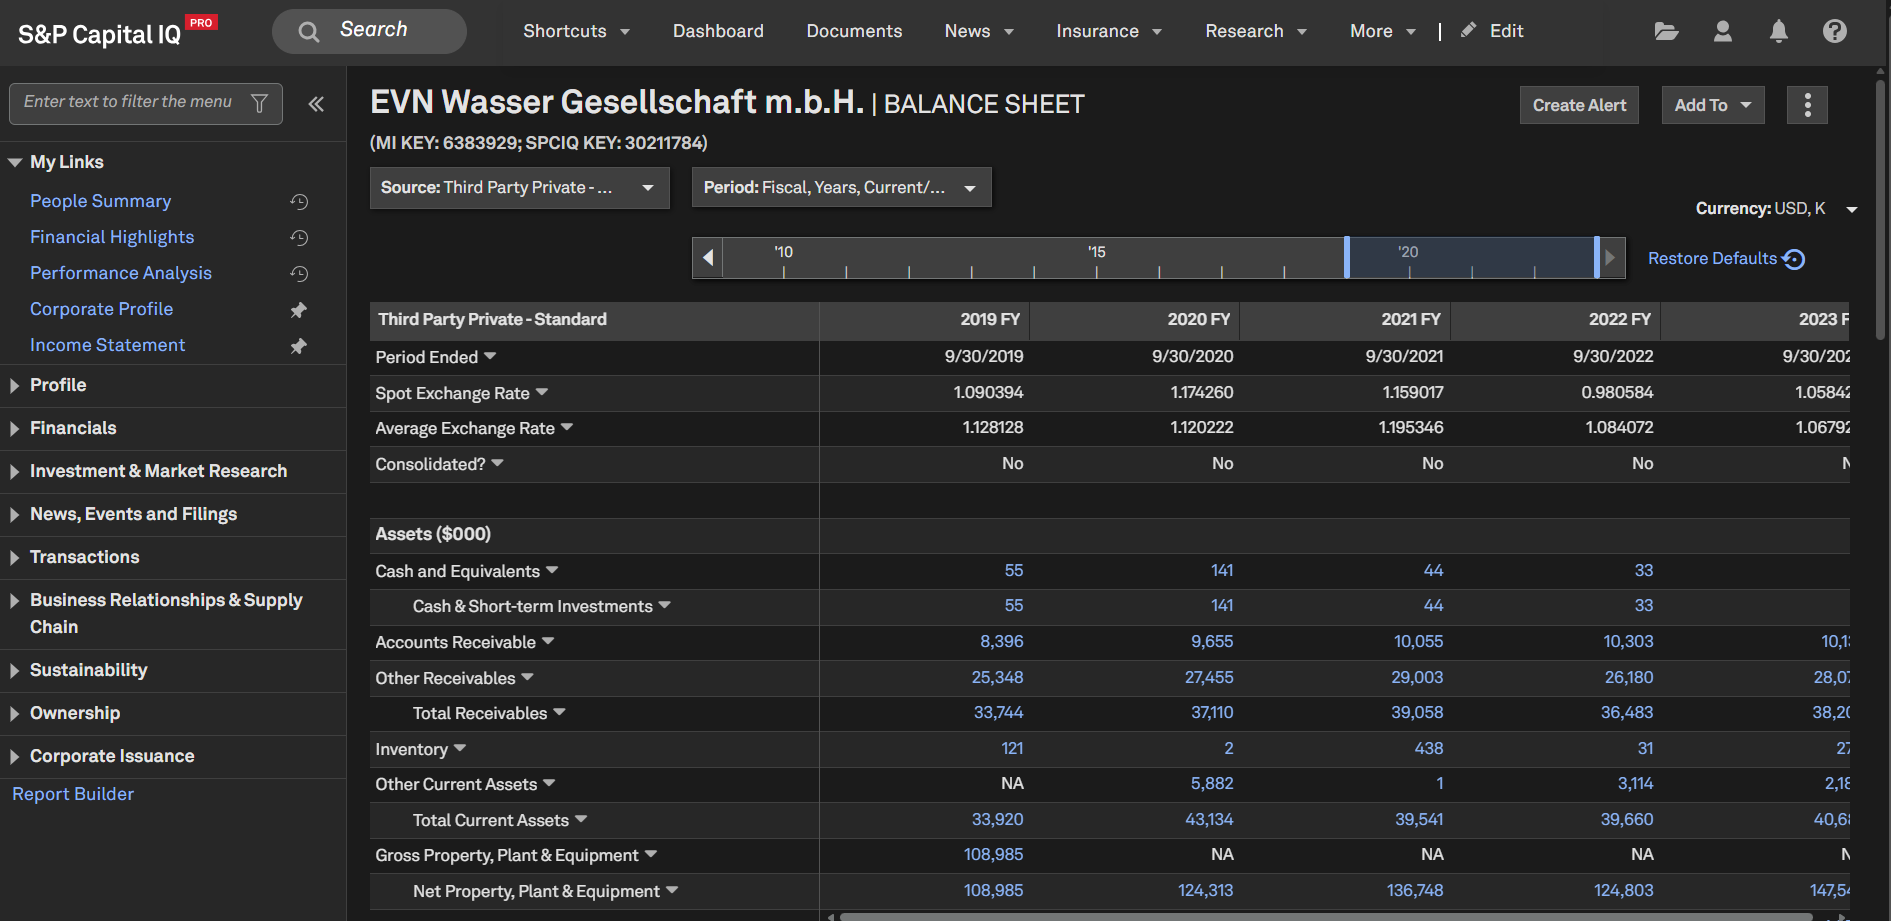
Financials and Firmographics for Austria Private Companies
Users can access additional financial and firmographic data for small and medium enterprises in Austria, significantly enhancing coverage in this market.
Find it in the platform:
Search and select a Austria private company in the top search to navigate to its Corporate Profile
In the left-hand navigation, navigate to Financials > Templated
Coverage stats:
190K private companies
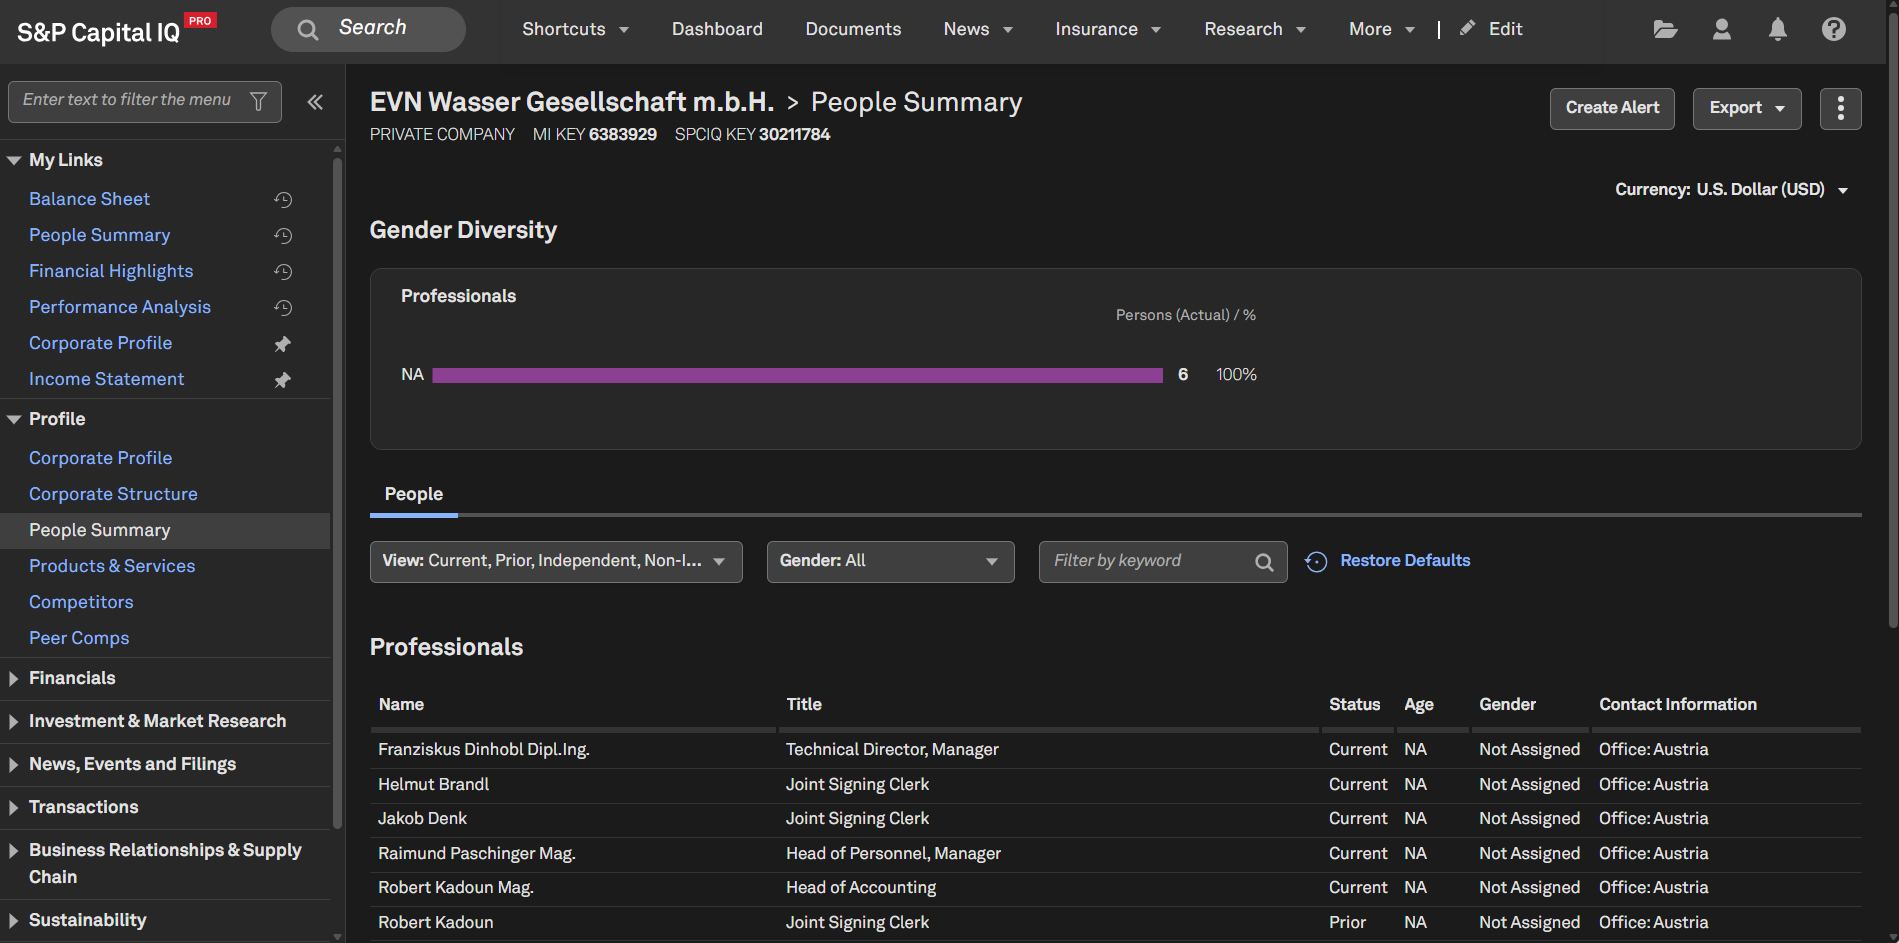
Directors & Officers data for Austria Private Companies
Users can access additional officers and directors for small and medium enterprises in Austria.
Find it in the platform:
Search and select a Austria private company in the top search to navigate to its Corporate Profile and scroll down to view the Officers & Directors widget
In the left-hand navigation, navigate to People Summary
Coverage stats:
938K private companies
Alerts
In this release, we introduced real-time alerts featuring premium content from The Deal.com, delivering real-time insights into private markets, M&A activity, and critical deal intelligence directly to the inboxes of users subscribed to both S&P Capital IQ Pro and The Deal.com platforms. Additionally, our new Subscription Center provides a unified destination for discovering and managing newsletters and editorial subscriptions, with enhanced search, industry-specific filters, and curated categories to personalize the Capital IQ Pro content experience.
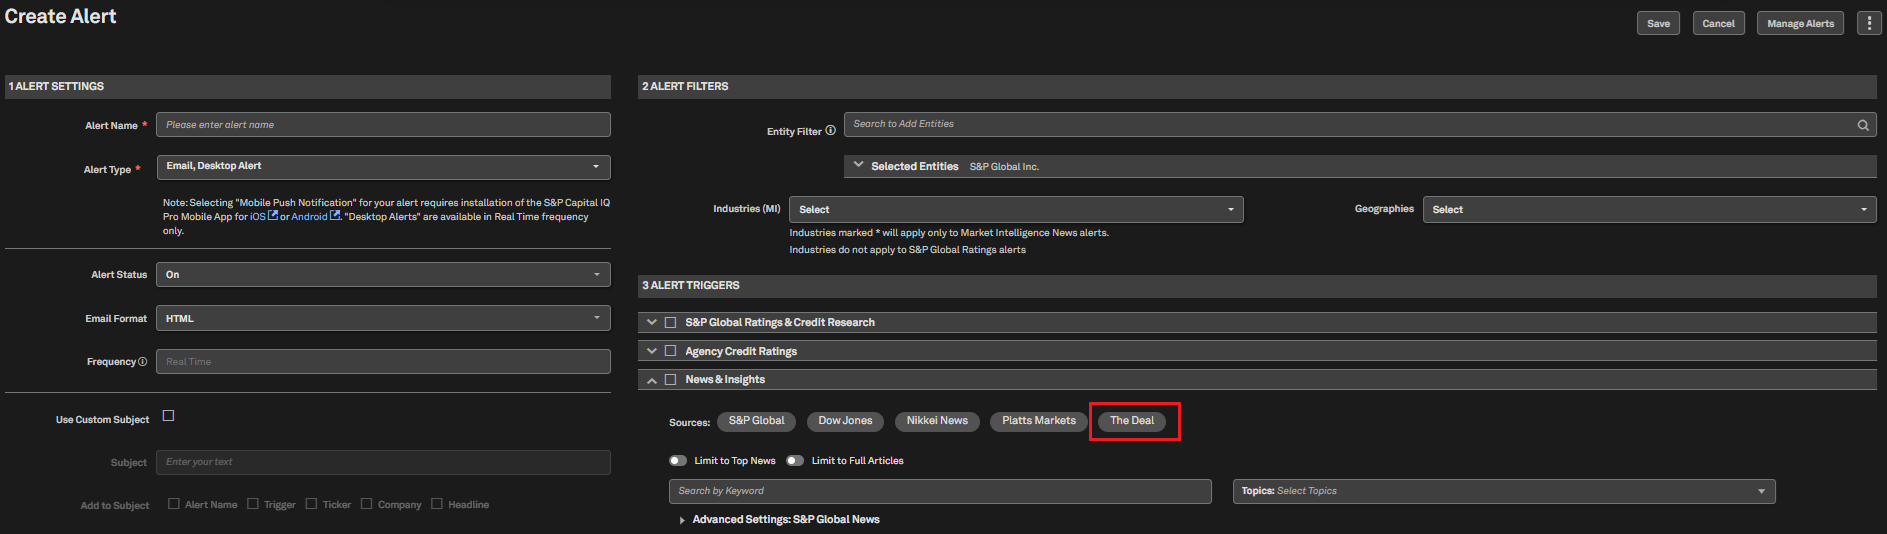
The Deal Alerts Now Available on S&P Capital IQ Pro
For subscribers of The Deal.com, users can now receive timely notifications about private markets, M&A deals, and exclusive insights as soon as articles are published. This integration extends our powerful alert capabilities to The Deal’s premium content, ensuring content is delivered according to the user’s subscription level.
Find it in the platform:
Click on the Bell icon on the right-hand side of the top navigation to open the Desktop Alert panel
Navigate to the Create New Alert link from the panel
Select the necessary options from Alert settings, Alert filters, and add one or more entities to enable the News & Insights trigger
In Alert Triggers, select News & Insights and select The Deal as the source
Add keywords and topics to further customize the content
Click Save on the top right-hand corner
Note: Access to The Deal’s alerts requires an additional subscription. Please contact your account team for details.
Subscription Center
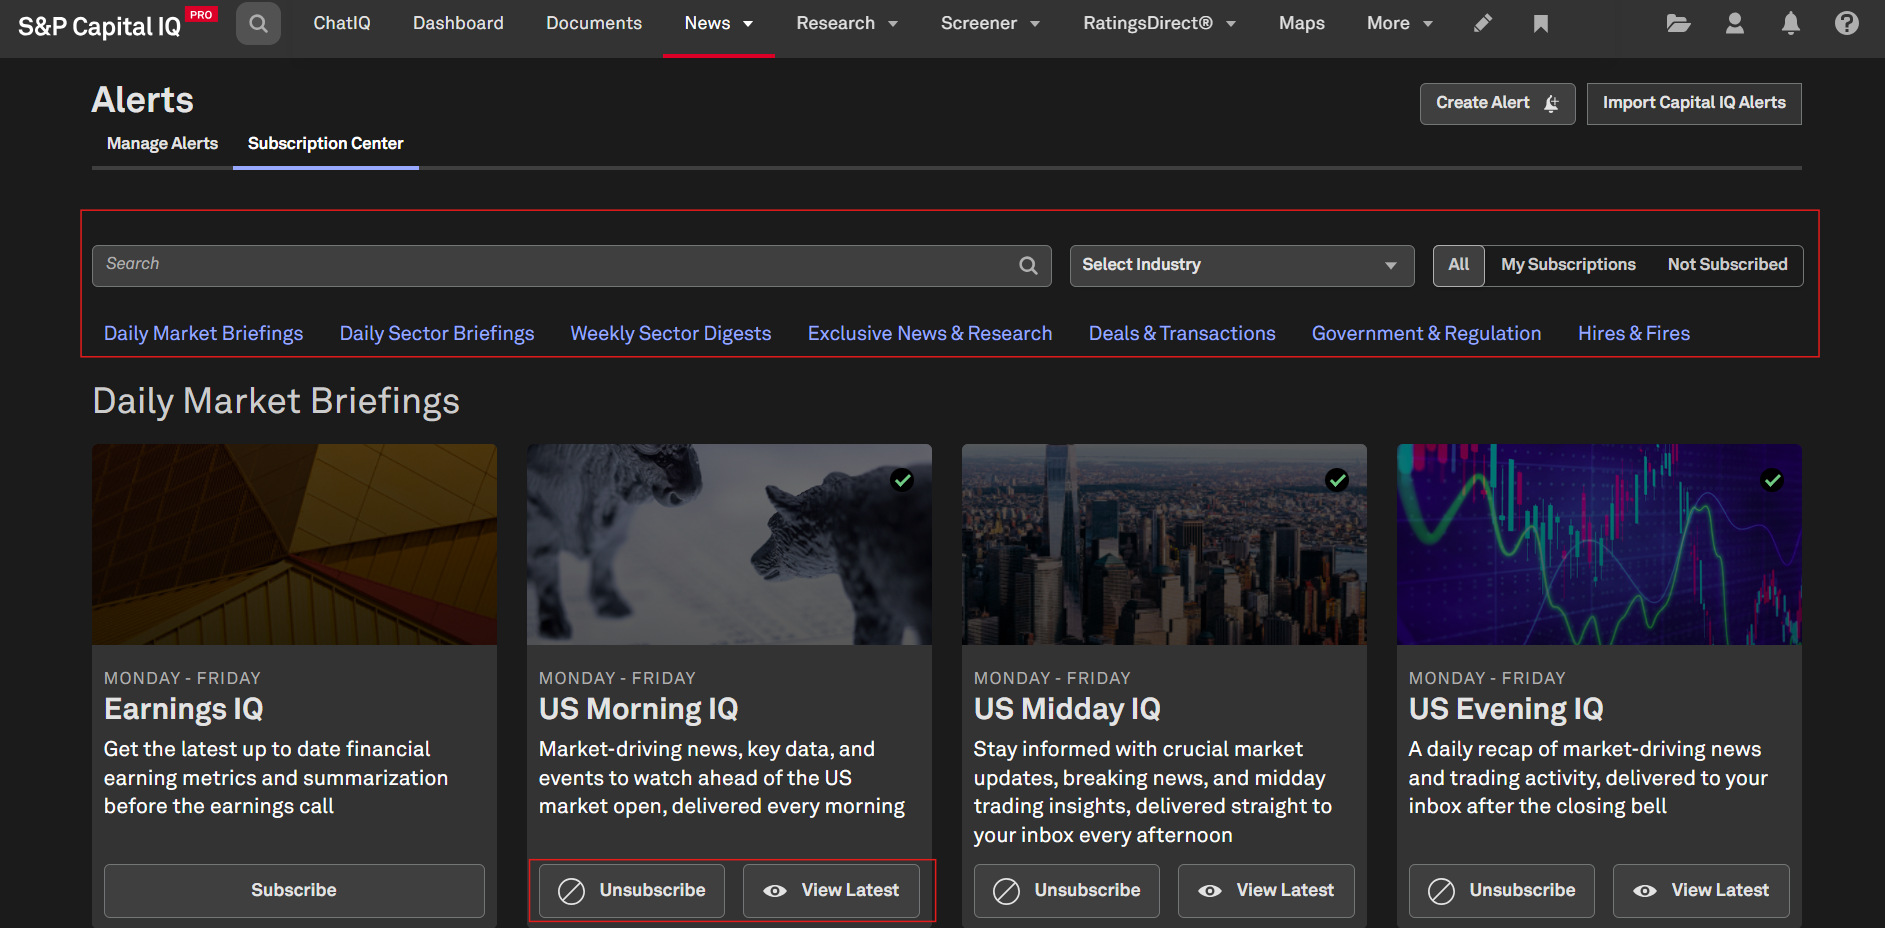
All newsletter and editorial subscriptions are now unified in a single Subscription Center, providing an improved user experience for discovering, managing, and subscribing to Capital IQ Pro's exclusive content, including IQ Newsletters and Earnings IQ alerts. The enhanced interface enables users to more easily discover newsletters and publications with improved search, industry-specific filters, and curated topical categories, and manage subscriptions in one place. This centralized approach makes it easier to personalize preferences and stay up-to-date on key market developments.
Find it in the platform:
Click on the Bell icon on the right-hand side of the top navigation to open the Desktop Alert panel
Navigate to Subscriptions from the panel
Use the search bar to find specific newsletters by keyword
Apply filters to narrow by industry or subscription status
To navigate through subscriptions –
Select All to view all available subscriptions
Select My Subscriptions to see only your active subscriptions
Select Not Subscribed to discover new content that’s not yet subscribed to
Click anchor links at the top to view specific content categories
Click Subscribe on any feature card to start receiving that content
Click View Latest to preview content before subscribing
To unsubscribe from any alert, click Unsubscribe on the feature card
Fixed Income
In this release, we integrated Markit’s Global Sector Curves into S&P Capital IQ Pro, providing deeper insights into global bond market movements with access to over 350,000 Global Sector Curves with fixed-rate and floating-rate note (FRN) coupon types and broad coverage across geographies, currencies, industries, ratings and seniorities, including more than 6 million tenors. This integration includes comprehensive pricing data, including a variety of spreads, and is available via the S&P Capital IQ Pro platform and S&P Capital IQ Pro Plug-in. We also introduced a new Rate Profile page, enabling users to visualize tenor-level trends using Yield Curve functionality or track historical rate movements with the Rate Chart tab. Additionally, we enhanced Institutional Profiles to display detailed public holdings of debt, providing access to current and historical debt holdings for asset managers.
Global Sector Curves and Yield Curve Profile
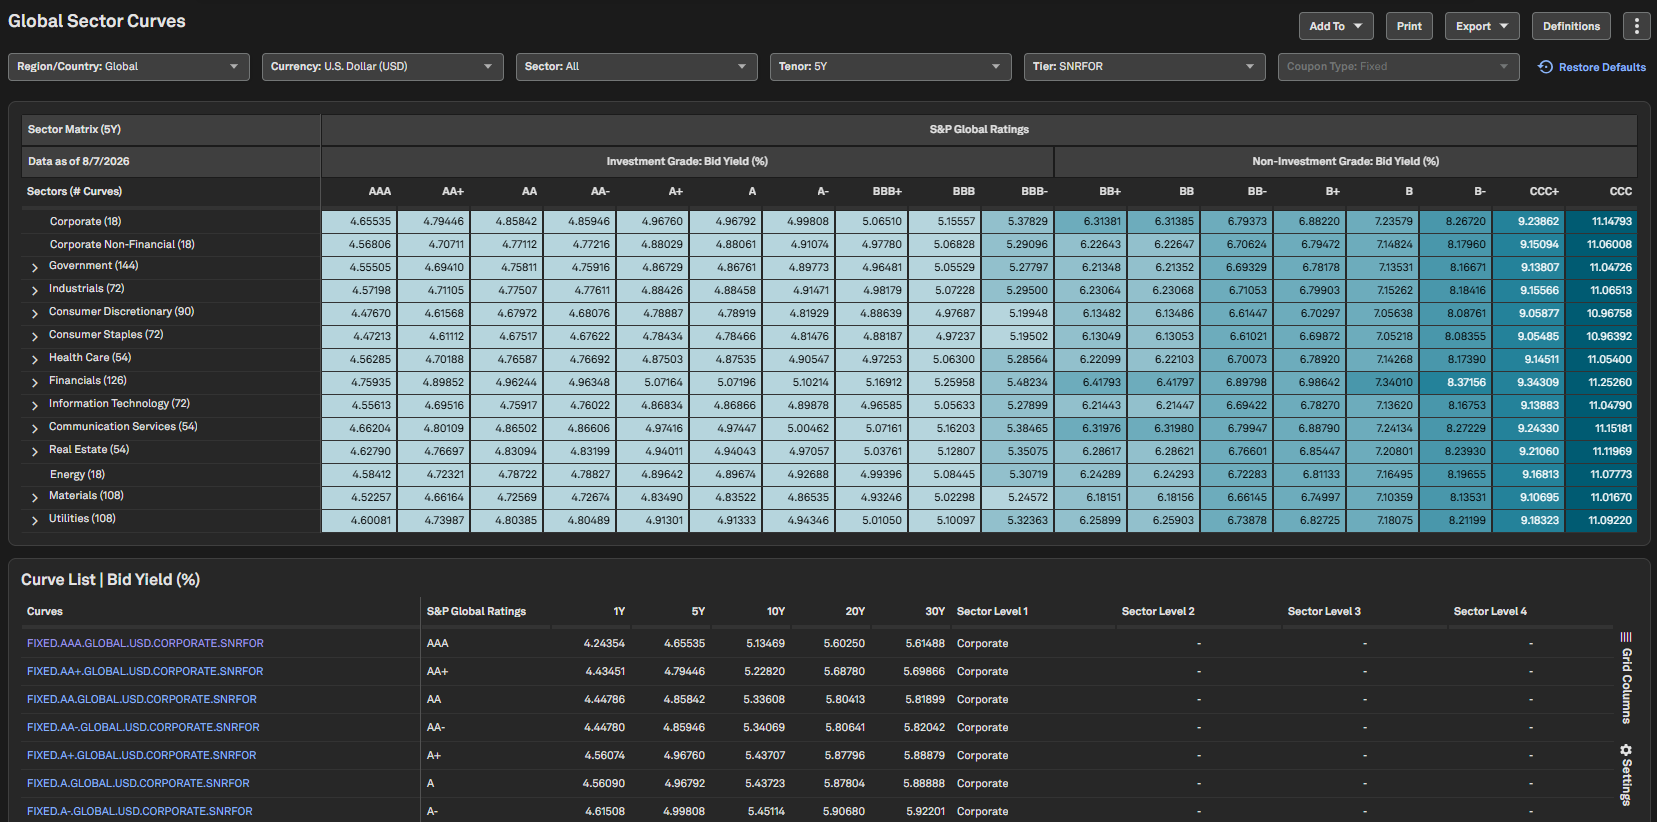
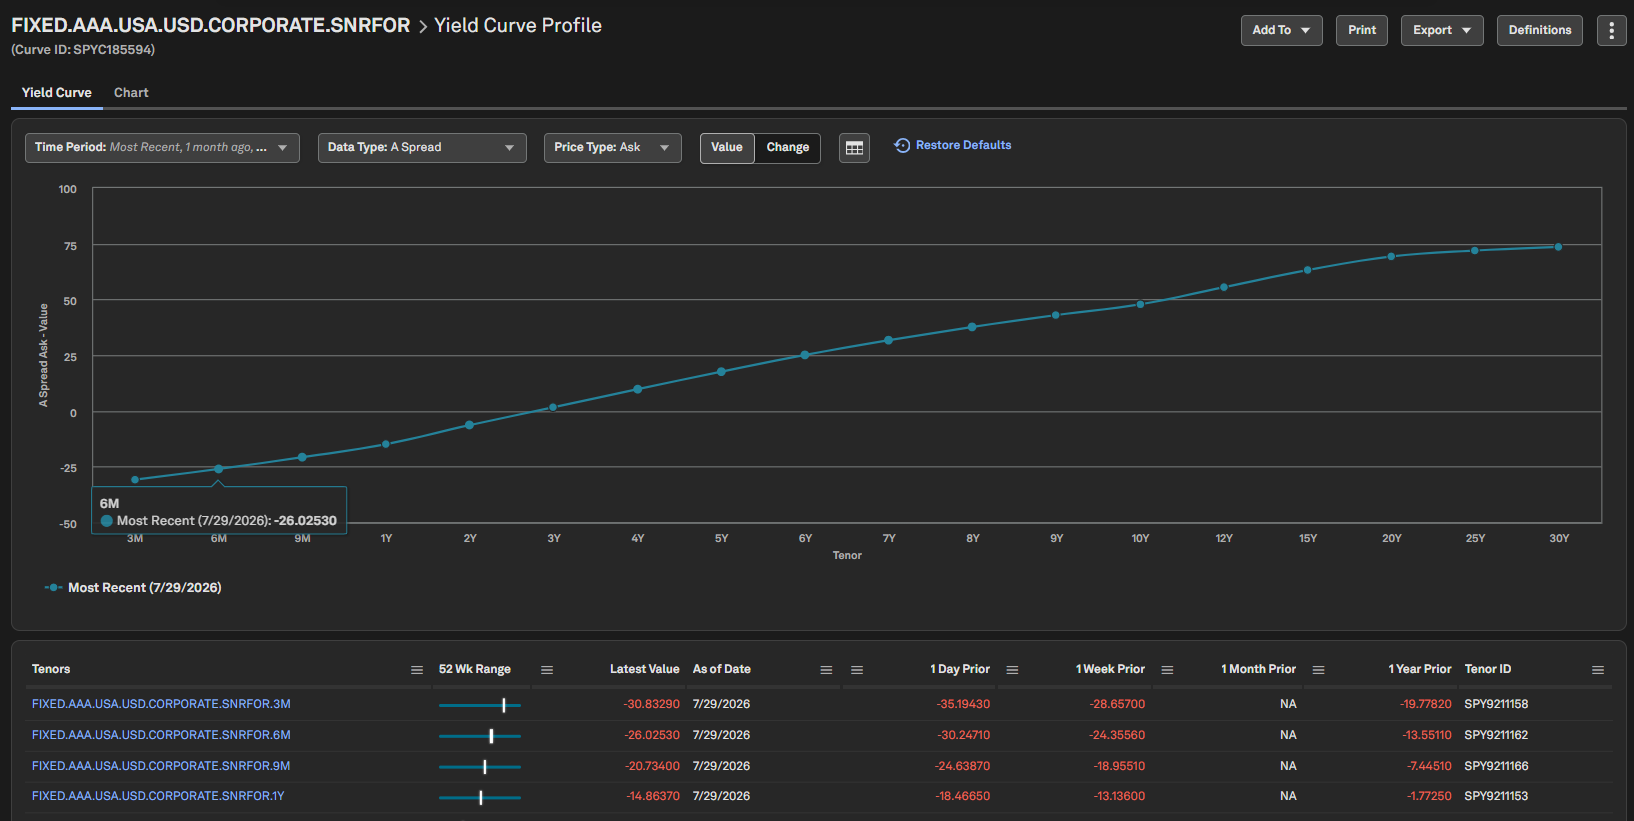
Users can now access over 350,000 global sector curves across fixed and floating-rate note coupon types, covering multiple currencies, regions, industries, ratings, seniorities, and tenors. This new content includes comprehensive pricing data, including Yield to Maturity, A Spread, A Spread over RFR, Discount Margin, Z Spread, and Z Spread over RFR. The new Global Sector Curves page enables users to assess market direction within specific combinations of region or country, currency and tenor. Additionally, the new Yield Curve profile page allows users to analyze trends for specific Global Sector Curves by evaluating the overall yield curve or viewing historical price charts for specific tenors.
Find it in the platform:
Global Sector Curves
Navigate to the Markets tab from the top navigation
Under Fixed Income, select Global Sector Curves
Apply filters such as Region/Country and Currency to focus on the required fixed income market
View the Sector Matrix heatmap to compare yields across sectors and ratings
Further refine results using Tenor and Tier options
Review detailed curve information in the Curve List grid
Click on the desired curve name in the grid to view the Yield Curve Profile
Alternatively, search for a specific curve from the top search and click on the relevant result to access the Yield Curve Profile
Yield Curve tab
In the Yield Curve tab, plot Bid/Ask yields or Spread metrics across available tenors for a selected date and relative periods
Switch to table view to assess the underlying data for the Yield Curve chart
Use the tenor grid at the bottom to compare each tenor’s latest value with prior observations, including 1-day, 1-week, 1-month, and 1-year historical points, while viewing the latest value in context of its 52-week range
Chart tab
In the Chart tab, plot required tenors with selected pricing metrics over historical periods to analyze tenor movements
Select multiple tenors using checkboxes in the bottom grid to evaluate relative pricing movements
Switch to table view to assess the underlying data for the Pricing chart
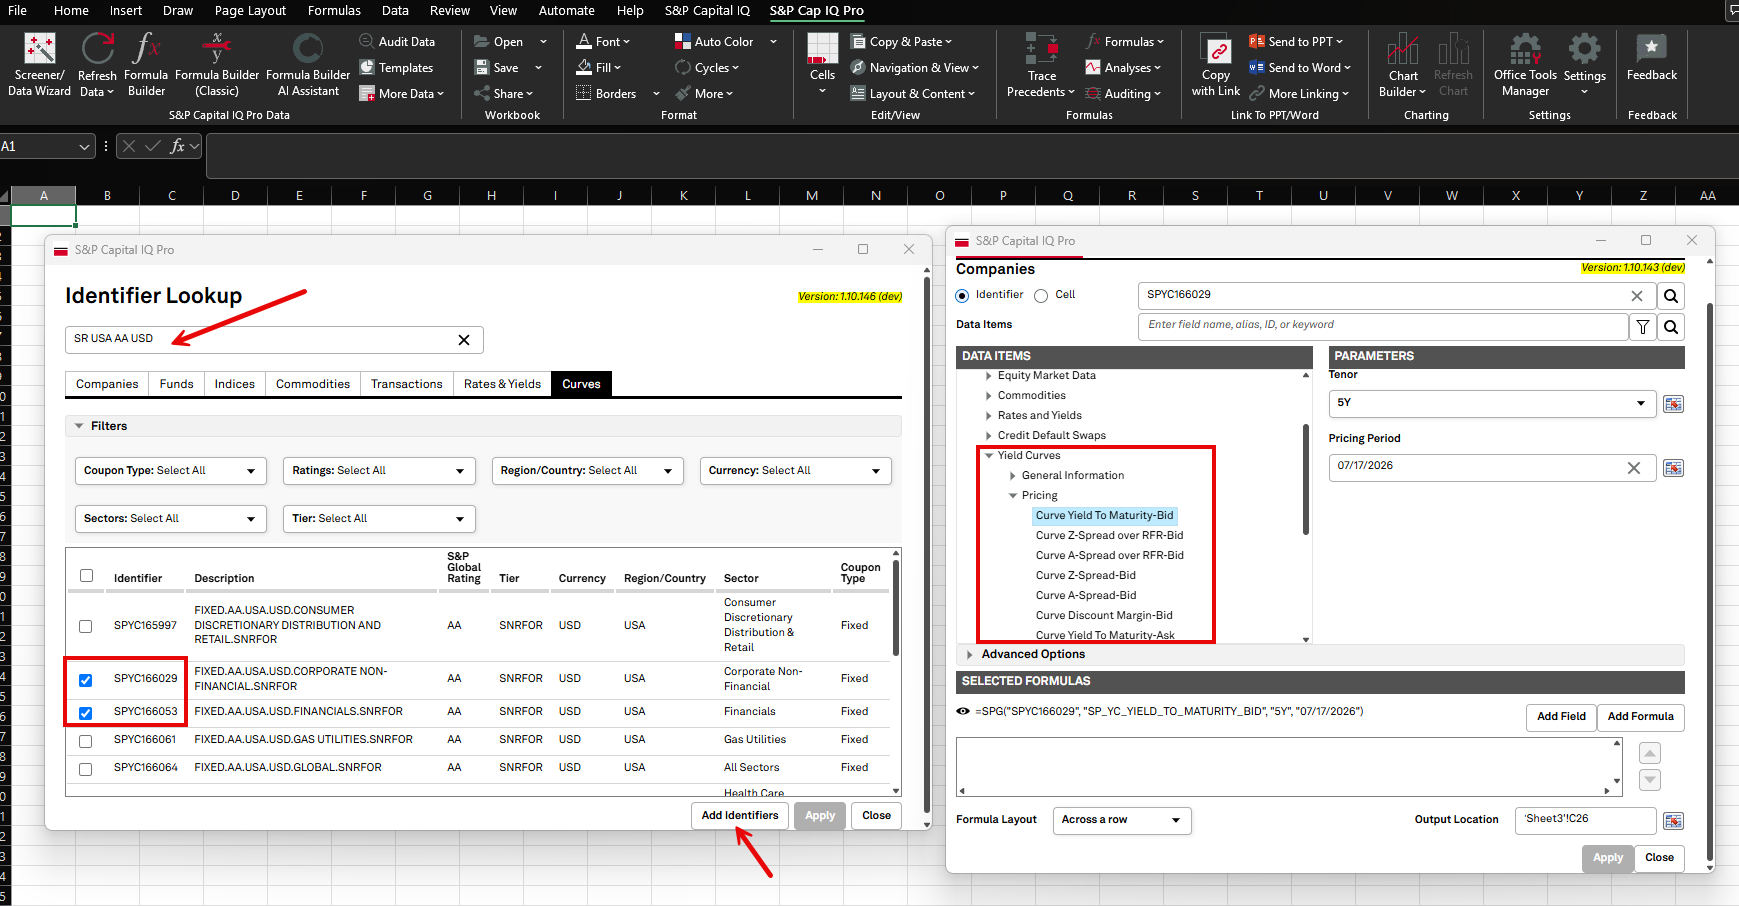
S&P Capital IQ Pro Plug-in
In Excel, launch the S&P Capital IQ Pro Plug-in and open Formula Builder
Search for the curve of interest in the Identifier Lookup
Refine the results using available filters—such as Region, Country, Currency, Sector, Rating, Seniority, Coupon Type, and Tenor—to identify the required global sector curves
Select one or more curves from the filtered results and add their identifiers to the worksheet
These are returned as SPYCs Curve IDs and use them as the input when building formulas in the formula builder
Alternatively, use the Identifier Search within formula builder to search the curve of interest under the Curve tab
In the Companies workflow, navigate to Market Data > Yield Curves and use the same SPYCs Curve ID to retrieve reference data such as Curve Name, Currency, Sector, Rating, Seniority, Coupon Type, and Tenor, as well as pricing metrics including Yield to Maturity, A Spread, A Spread over RFR, Discount Margin, Z Spread, and Z Spread over RFR
Copy formulas across multiple SPYCs Curve IDs to compare reference and pricing data for multiple curves and/or dates directly in Excel
Rate Profile
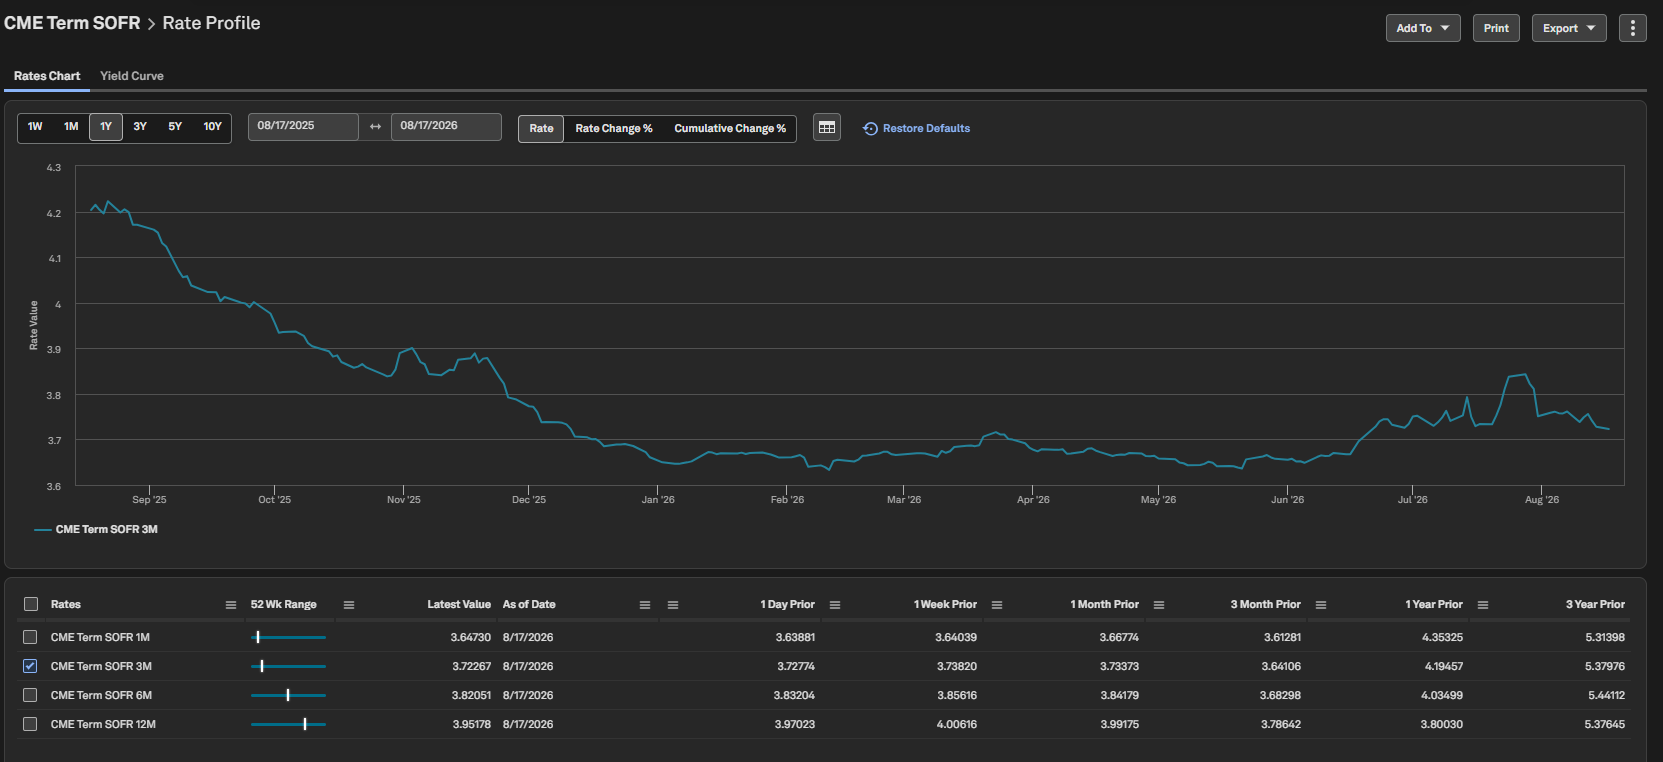
Users can search for a rate from the top search and navigate directly to the Rate Profile page, where the selected rate tenor is plotted on the Rate Chart. The profile page also offers access to Yield Curve functionality when available, enabling users to review rate movements, compare tenor-level trends, and analyze rates data within a single, consolidated workflow.
Find it in the platform:
Search for a rate of interest in the top search or select the relevant Rate name on the Rates & Yields page to open the new Rate Profile page
On the Rate Chart, view the selected rate tenor plotted by default
Use the chart functionality to analyze historical rate movements and review changes in the tenor over time
Select multiple tenors from the bottom grid to compare their movements over time
Use the data grid at the bottom to compare each tenor’s latest value with prior observations, including 1-day, 1-week, 1-month, and 1-year historical points, while viewing the latest value in the context of its 52-week range
Use the Yield Curve functionality from the Rate Profile page to plot all available tenors for the selected rate family on a selected date
Compare the yield curve across different as-of dates using the relative date function
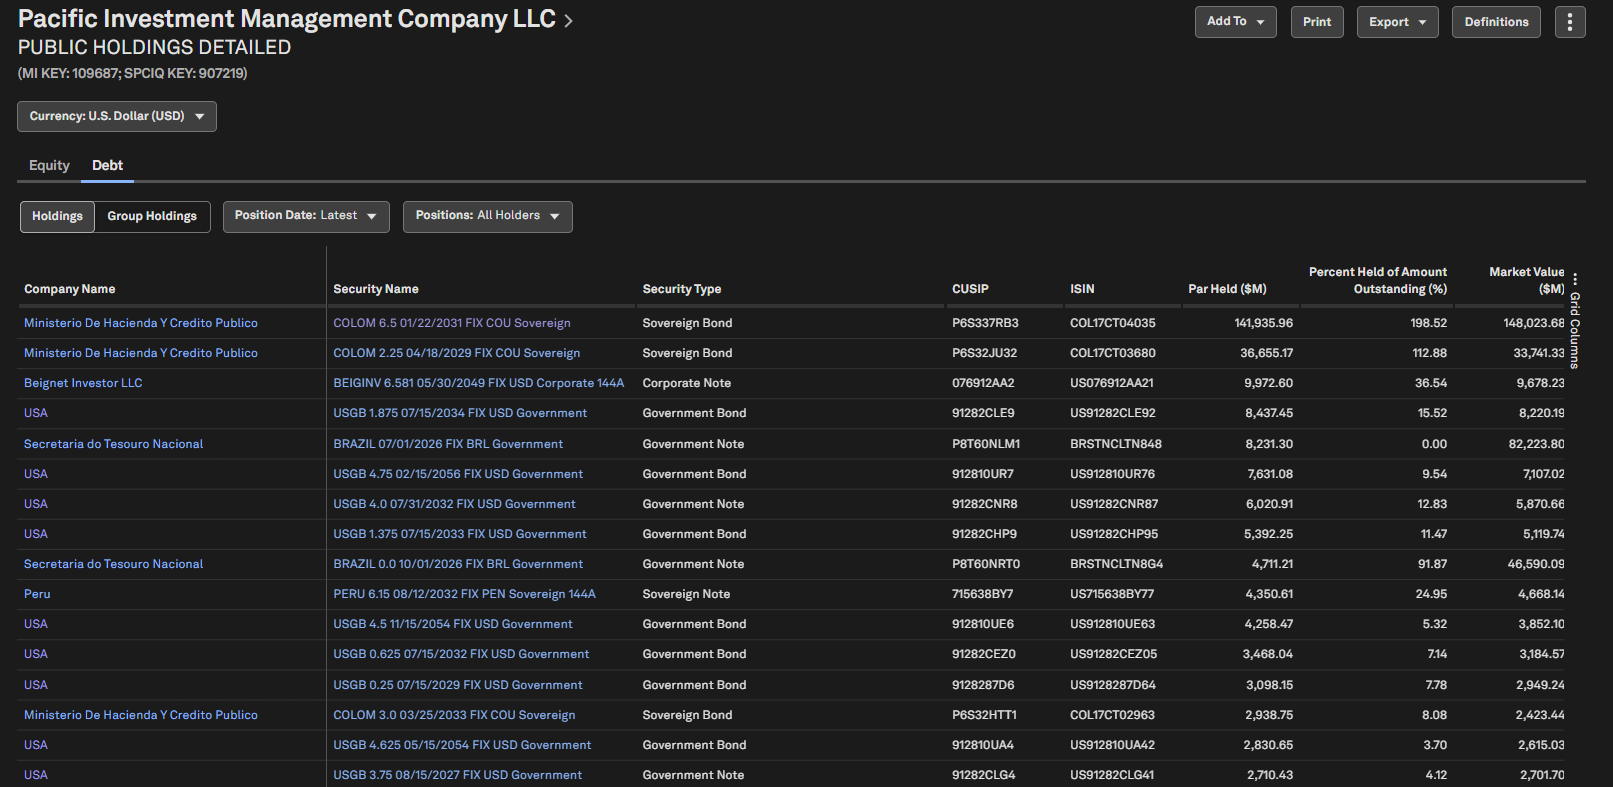
Detailed Debt Public Holdings for Institutional Profiles
Users can now view both current and historical debt holdings of asset managers in a detailed, customizable grid, providing a more comprehensive view of portfolio exposures and changes over time.
Major Highlights:
Historical & Current Holdings: View current holdings of an institution and those on any selected historical quarterly date
Detailed Grid: Access a comprehensive view of debt holdings in the grid, enabling investment analysis by security name, issuer, sector, and geography, along with key metrics such as par held, market value, and holding changes over time, empowering users to uncover investment trends and gain deeper insights into an institution’s debt investment strategy
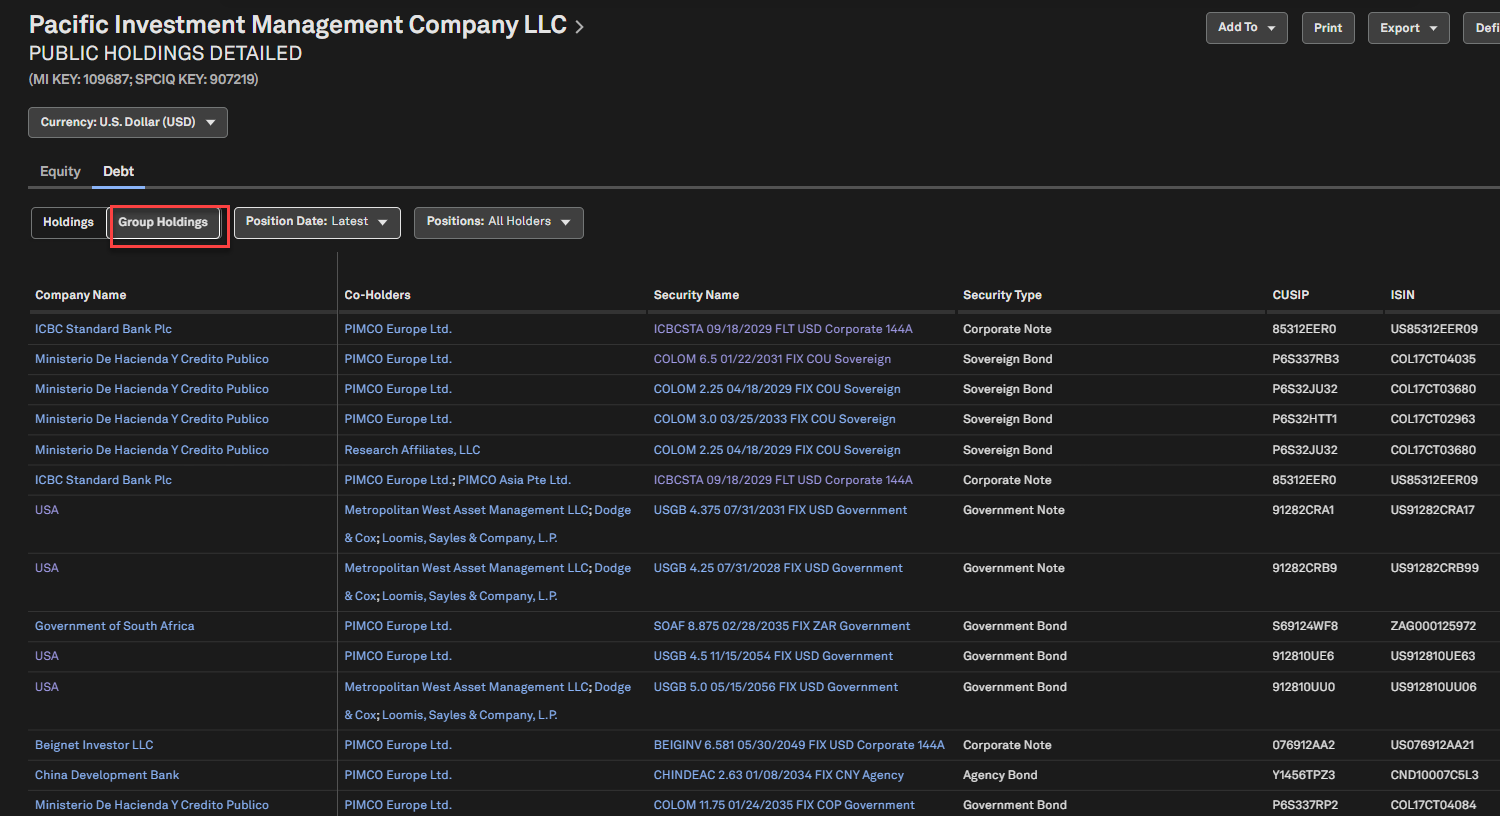
Group Holdings Toggle: Enhance ownership transparency by identifying when an institution co-holds debt security positions with other institutions, helping users better assess investment concentration and debt ownership stakes
Grid Customization: Personalize the Holdings grid using the Grid Columns sidebar. Show or hide specific columns for a more flexible and relevant analysis experience
Find it in the platform:
Search for and select an Asset Manager’s profile in the top search
In the left-hand navigation select Investments > Public Holdings > Public Holdings Detailed
By default, the Equity tab will be displayed if the institution has equity holdings; navigate to the Debt tab to access debt holdings
If the institution does not have equity holdings, the Debt tab will display by default, listing all debt holdings of the institution
Document Intelligence
In the release, users can upload proprietary documents to S&P Capital IQ Pro, enabling them to leverage the full suite of Document Intelligence and ChatIQ features. Additionally, newly published Excel and PowerPoint files will now open directly in Document Intelligence, enabling immediate access without downloading.
Upload Documents in Document Intelligence
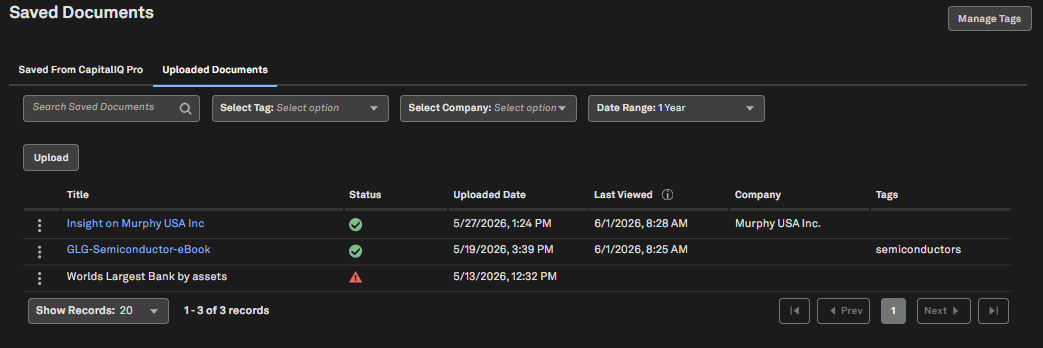
Users can now upload their own documents to S&P Capital IQ Pro for use in Document Intelligence and ChatIQ. All Document Intelligence features - single and multi-document chat, ChatIQ, table and entity extraction, and both in-document and cross-document search - can be applied to these proprietary documents.
Find it in the platform:
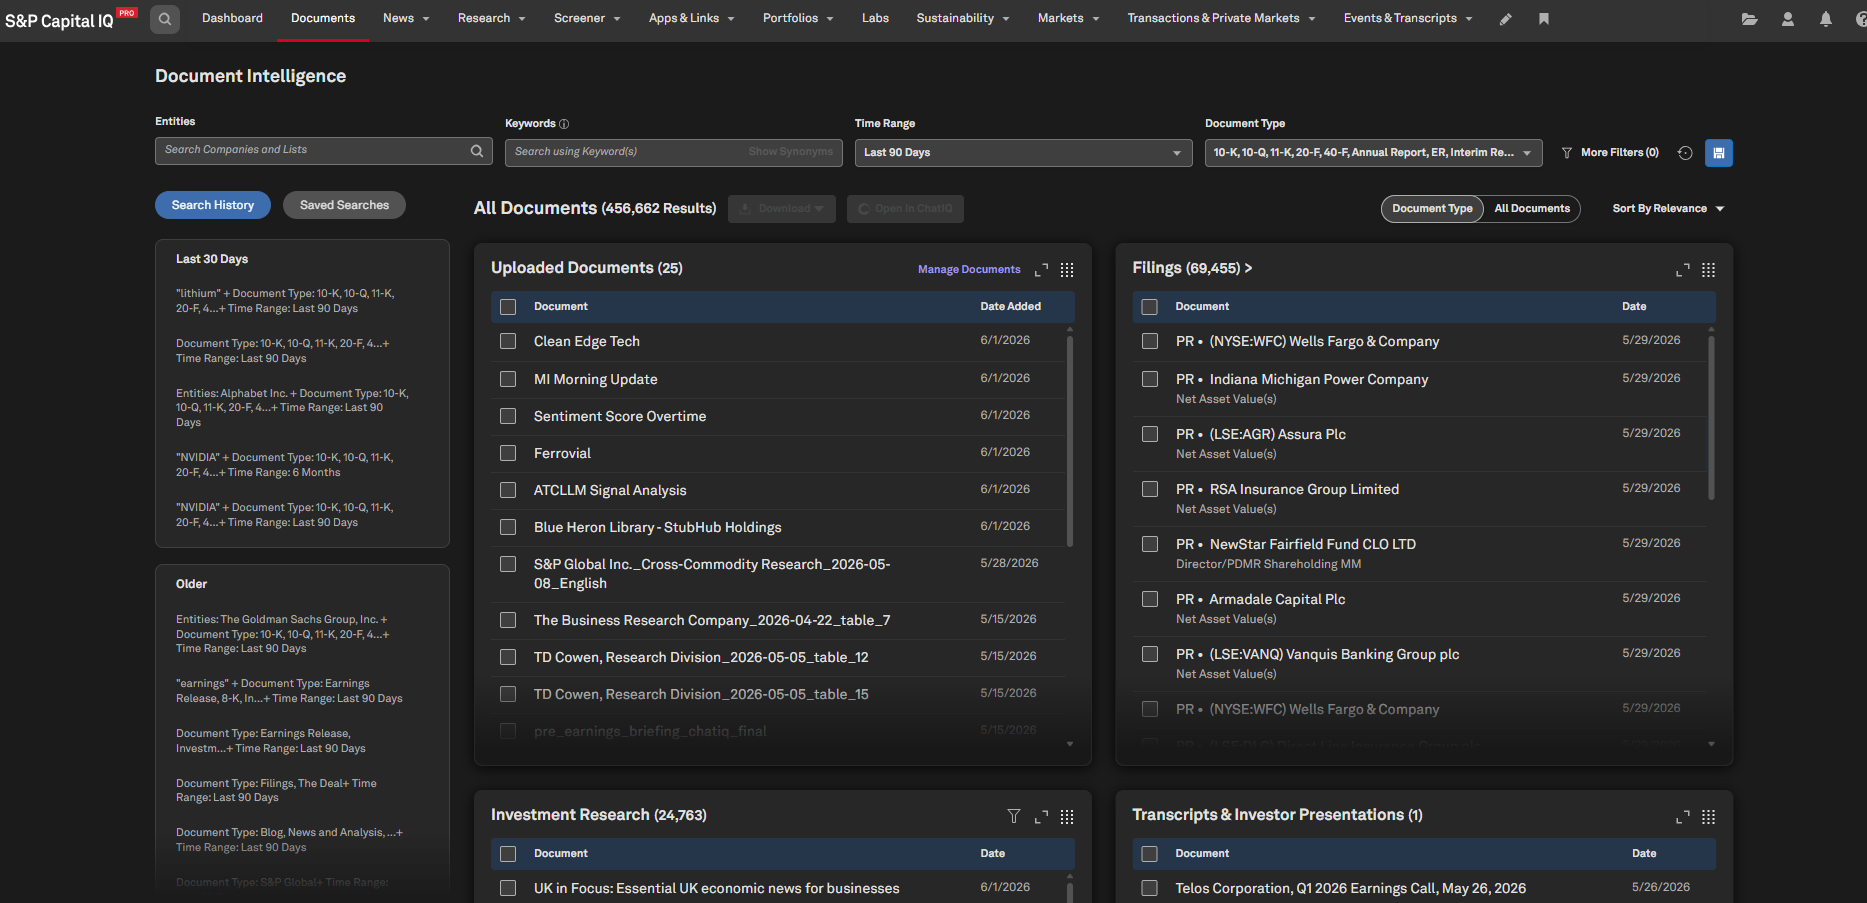
Navigate to the Documents tab in the top navigation to access the Document Intelligence page
Select Add/Manage Documents
Click on Upload and select the documents from your local drive to upload them
Scroll down to the Uploaded Documents tile to view them
Coverage Stats:
Supports XLS, XLSX, PPT, PPTX, DOC, DOCX, PDF, HTML documents up to 100 mb. If any document is not utilized within this capability for a period of a year, this document will be deleted.
Note: Please contact your account team to access this new feature.
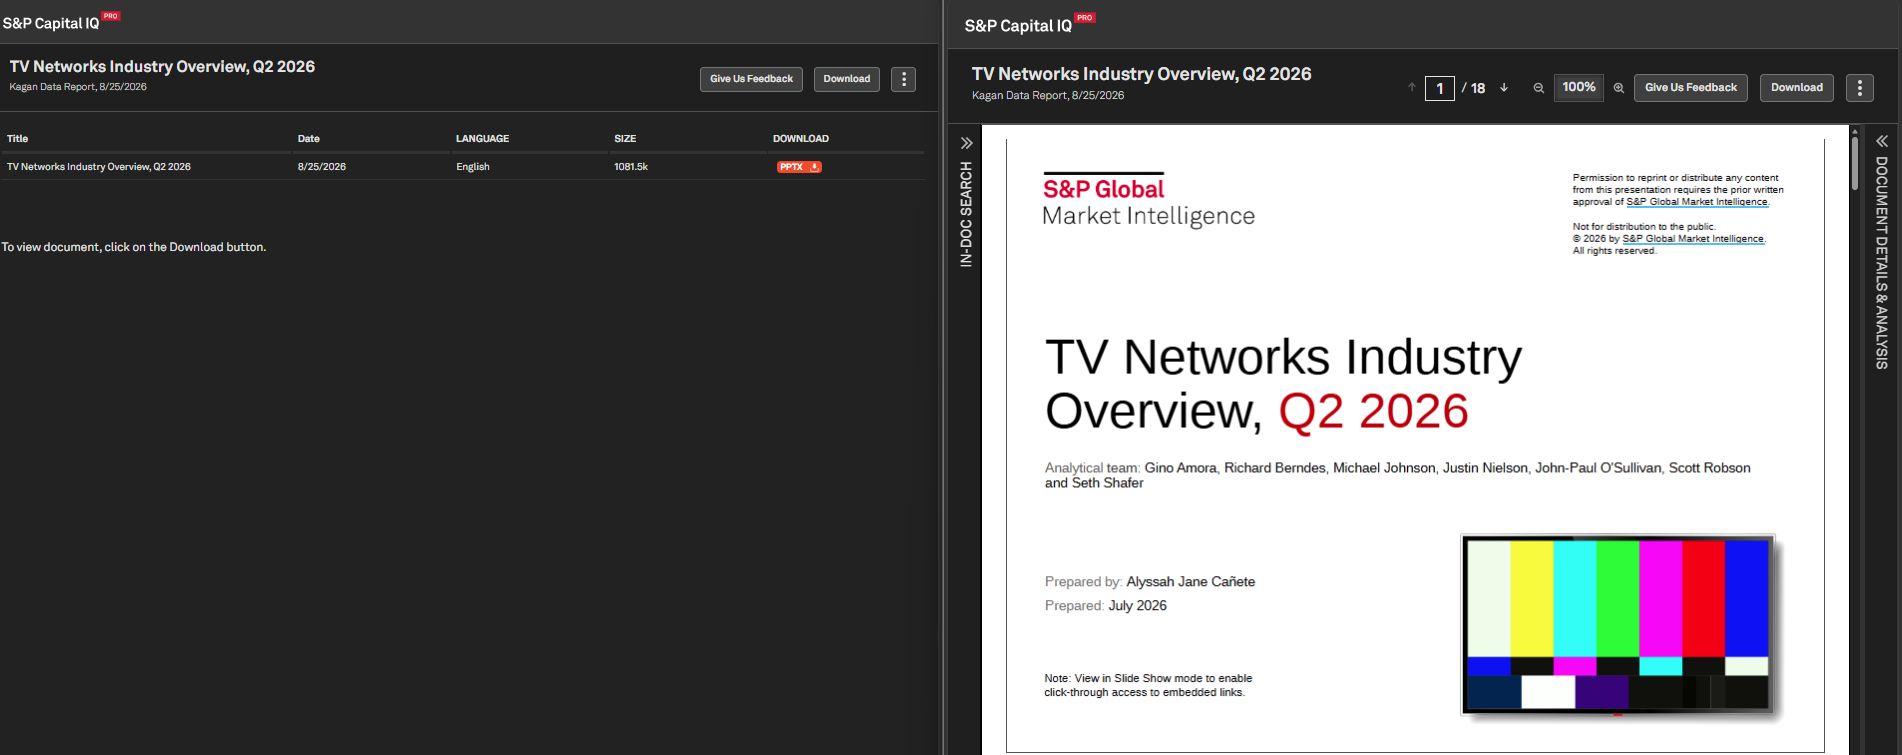
Enhanced Viewing Experience for Excel and PowerPoint Documents
Users can now seamlessly access Excel and PowerPoint documents available in the Investment & Market Research repository in Document Intelligence without downloading them, and can leverage the full suite of viewer capabilities, including table extraction and ChatIQ.
Find it in the platform:
Navigate to the Research tab in the top navigation, select Investment & Market Research, and open a newly published Excel or PowerPoint document
Alternatively, in Document Intelligence, navigate to the Sector & Economic Reports widget and open a document marked with an Excel badge
Note: This capability is available for new Excel and PowerPoint files published from September 14, 2026. Support for previously published files will be available in the future
News
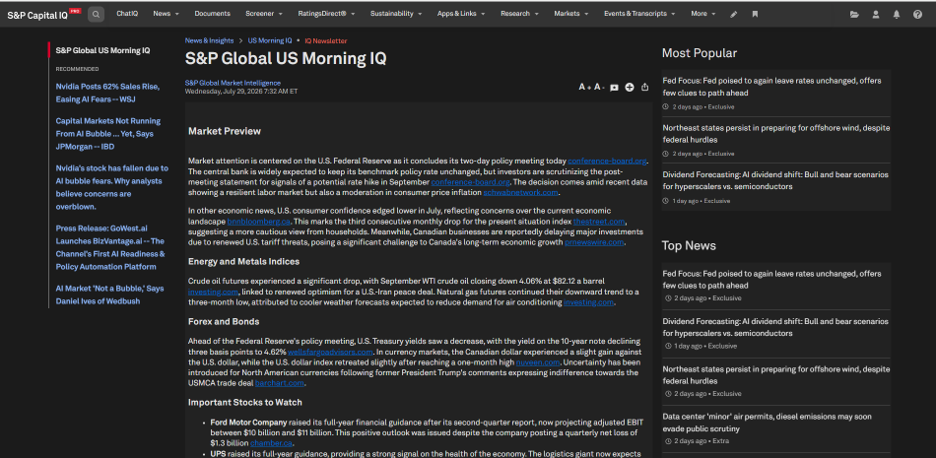
In this release, the popular IQ Newsletters are available directly within the S&P Capital IQ Pro desktop experience, making it easier to access timely market insights alongside your research and workflow.
Morning IQ, Midday IQ, and Evening IQ Market Briefings
The Morning IQ, Midday IQ, and Evening IQ briefings use AI-powered curation to deliver the most relevant market news, events, earnings updates, and analyst commentary across North America, EMEA, and APAC. Previously available only via email, these daily briefings are now accessible directly within the Capital IQ Pro platform, enabling users to stay informed on the latest news that matters most to their workflow.
Find it on the platform:
Navigate to the News tab in the top navigation
Select IQ Newsletters & Recaps from the dropdown menu
Screener
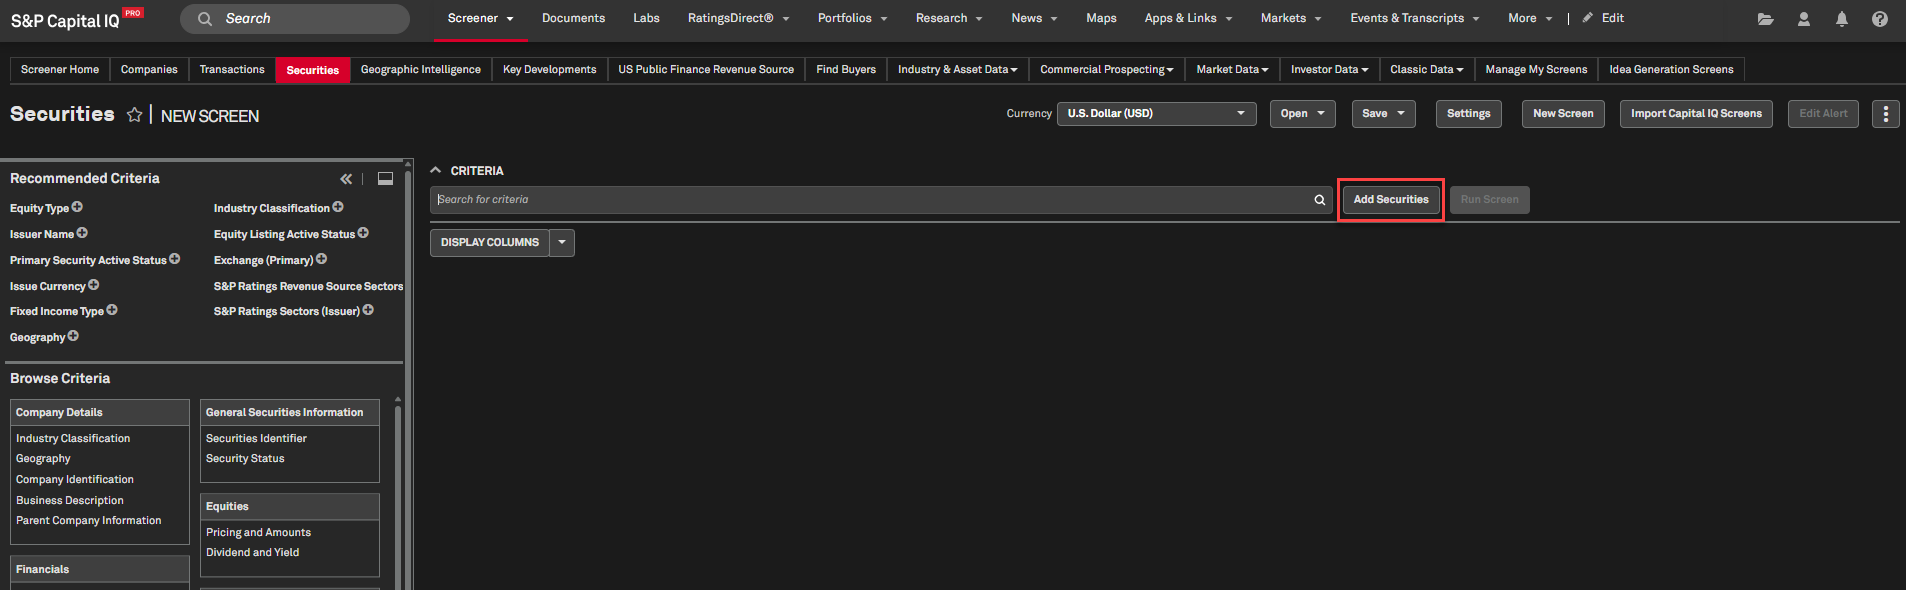
In this release, we enhanced the ‘Add Securities’ feature within the Securities dataset in Screener, enabling users to easily add companies, funds, securities, company portfolios, and lists of companies and securities. We also added an Entity Scope dropdown, which provides the option to add only the primary security when adding a public company. Additionally, we added the ability for users to filter their saved items on the Manage My Screens page by dataset, type, owner, and keyword, making it easier to quickly locate and organize relevant information.
Add Securities
Users can use the ‘Add Securities’ feature within the Securities dataset in Screener to add companies, funds, equity or fixed income securities, company portfolios, and lists of companies and securities.
With the new Entity Scope dropdown, users have the option to select ‘Watchlist View’ to add only the primary security when adding a public company through the Add Securities feature.
Find it in the platform:
Navigate to Screener from the top navigation or the Apps & Links menu
Select Securities dataset
Click Add Securities and search for the desired company, fund, security, list, or portfolio
Select an option from the Issuer, Ultimate Parent or Watchlist View from the Entity Scope dropdown
Click Add Criteria
Select Run Screen to view the results
Filters on Manage My Screens
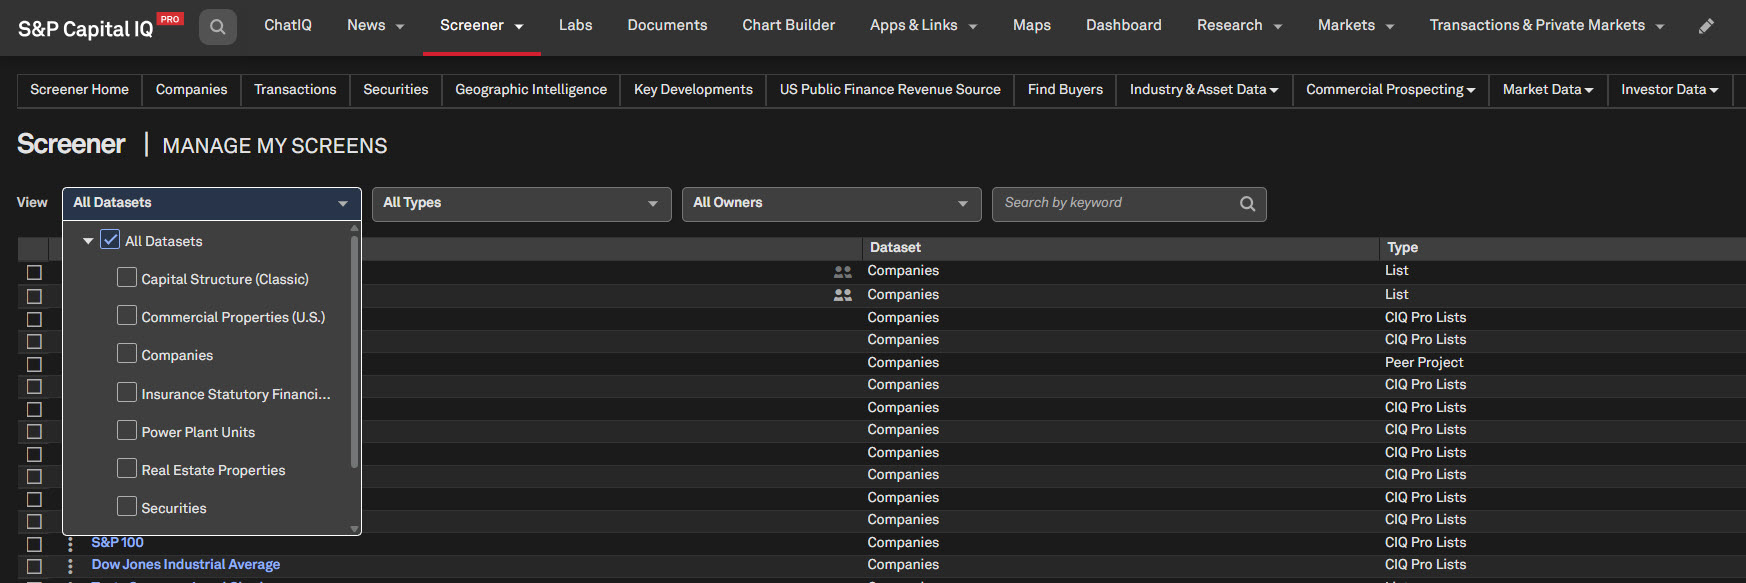
Users can now filter saved items on the Manage My Screens page by dataset, type, owner, and keyword.
Find it in the platform:
Navigate to Screener from the top navigation or the Apps & Links menu
Select Manage My Screens and use the filters or keyword search to refine saved items in the results
Macroeconomic Data
In this release, we expanded our U.S. economic indicator coverage by adding over 50 new indicators across monthly, quarterly, and weekly frequencies. This enhancement broadens coverage across key areas of the U.S. economy, including housing and construction, industrial production, manufacturing, money and banking, labor markets, government receipts and expenditures, national income, personal income, energy, and wholesale activity.
U.S. Economic Indicators
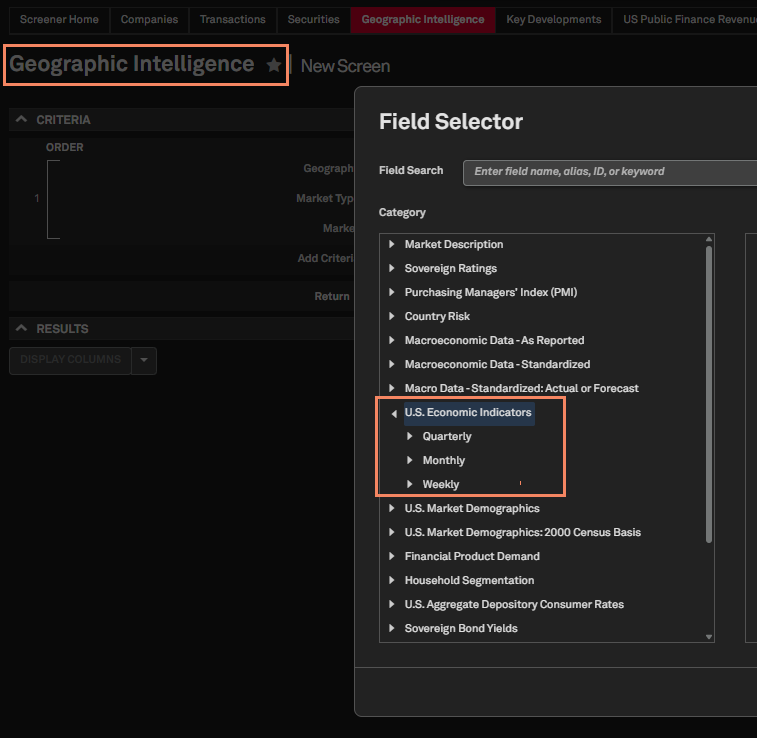
Users can now access new U.S. economic indicators across monthly, quarterly, and weekly frequencies, enabling broader analysis of key sectors. View the full list of available indicators here.
Find it in the platform:
Navigate to Screener from the top navigation or the Apps & Links menu
Select Geographic Intelligence dataset and choose USA as the Geography
Under Add Criteria or Display Columns, select the U.S. Economic Indicators
Use the parameters to choose the desired time periods
Coverage stats:
50 new U.S. indicators across monthly, quarterly, and weekly frequencies
Market Data
In this release, we introduced Exchange Groups criteria in the Companies and Securities Screener, enabling users to screen companies or securities and group by exchange for more targeted, efficient results.
Exchange Groups in Screener
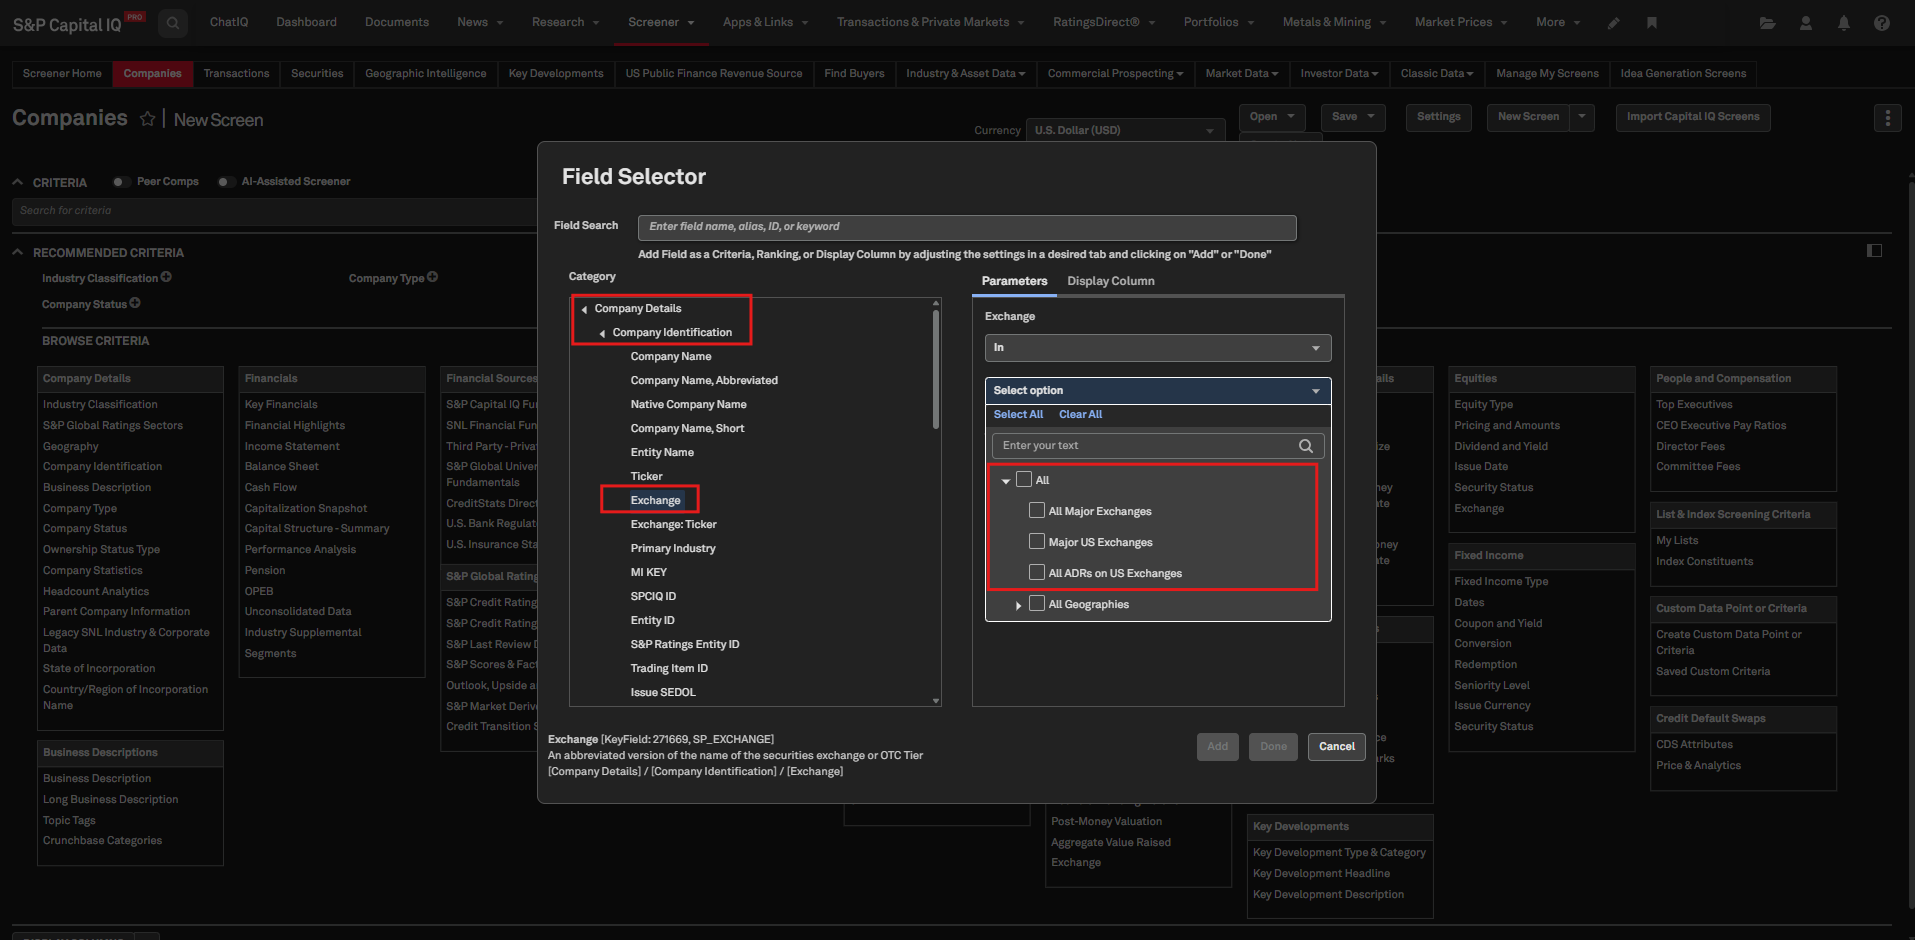
Users can now screen companies or securities using Exchange Groups, including All Major Exchanges, Major US Exchanges, and All ADRs on US Exchanges, streamlining data retrieval.
Find it in the platform:
Screener
Navigate to Screener from the top navigation or the Apps & Links menu
Select Companies or Securities dataset
Under Browse Criteria, click Company Details
In the Field Selector, expand Company Identification > Exchange
In the Parameters section on the right, set the first dropdown to In and select an exchange group: All Major Exchanges, Major US Exchanges or All ADRs on US Exchanges
Add criteria, and run the screen
S&P Capital IQ Pro Plug-in
In Excel, launch the S&P Capital IQ Pro Plug-in and open Formula Builder
Select Companies or Securities dataset under Key Workflows
Under Data Items, expand Company Identification > Exchange
In the Parameters section on the right, set the first dropdown to In and select an exchange group: All Major Exchanges, Major US Exchanges or All ADRs on US Exchanges
Sustainability
In this release, we enhanced our environmental data offering across Screener, S&P Capital IQ Pro Plug-in, and Dashboard by introducing new data points that provide access to third-party assurance information on companies’ GHG emissions.
Third-Party Assurance Details in Screener, S&Capital IQ Pro Plug-in and Dashboard
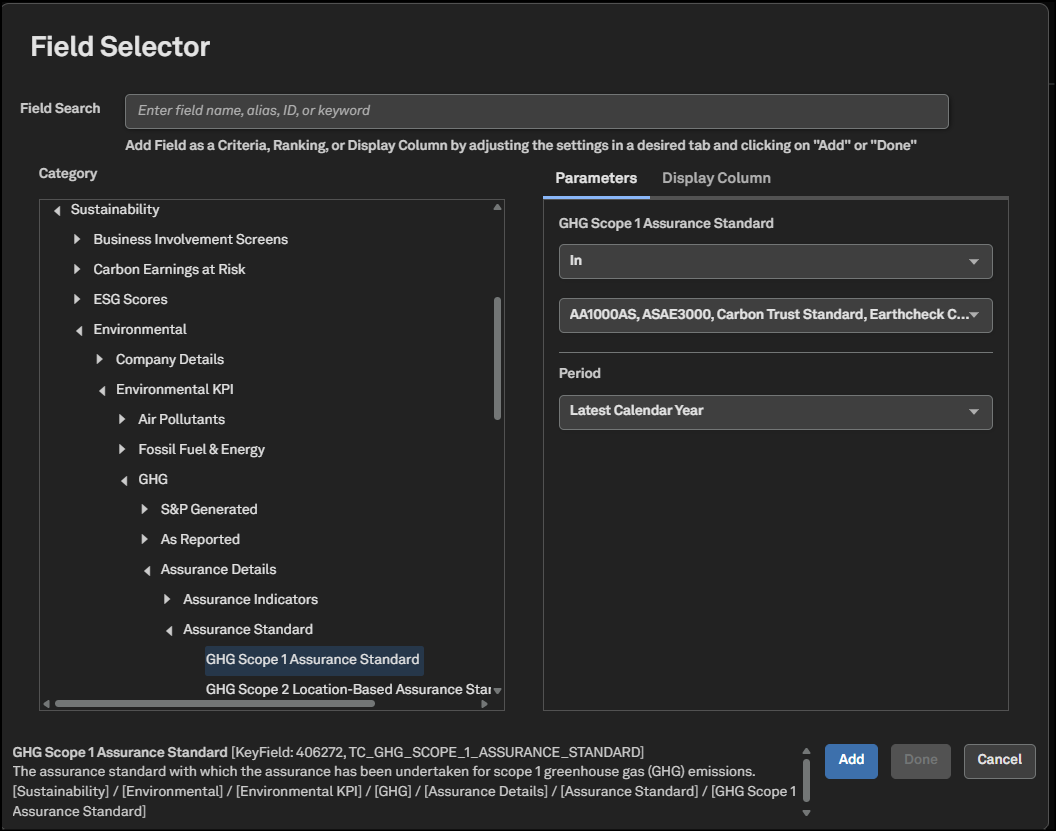
Environmental dataset users can now screen companies and access third-party assurance information related to their GHG emissions in Screener, S&P Capital IQ Pro Plug-in, and the Dashboard. Details such as the assurance standard used, assurance level, and assurance source offer greater transparency for both As-Reported and S&P-generated GHG emissions values across Scope 1, 2, and 3, where available. These enhancements support audit requirements and, where applicable, improve the PCAF data quality scores for emissions.
Find it in the platform:
Screener
Navigate to Screener from the top navigation or the Apps & Links menu and select Companies Screener
Select Companies view, navigate to the Sustainability category under Browse Criteria on the left
Expand Environmental > GHG > Assurance Details to find the assurance metrics
S&P Capital IQ Pro Plugin
In Excel, launch the S&P Capital IQ Pro Plug-in and open Formula Builder
Expand Sustainability > Environmental > Environmental KPI > GHG > Assurance Details
Dashboard
Navigate to Dashboard and open the Add Widget menu on the top right
Select List, Portfolio or Quote widget and open Field Selector using the settings gear icon at the top-right corner of the widget
Expand Sustainability > Environmental > Environmental KPI > GHG > Assurance Details
Note: Access to Environmental data needs an additional subscription. Please contact your account team for details.
Portfolio Analytics
In this release, we introduced AI-powered Portfolio Insights (Beta), expanded Portfolio Analytics performance coverage to include supported fixed income securities, and added the new Equity & FI Overview Featured Report for blended portfolio analysis. We also enhanced fixed income calculations by incorporating accrued interest into market value and portfolio weight calculations, and Exposure reporting now features a new Security column.
Portfolio Insights (Beta)
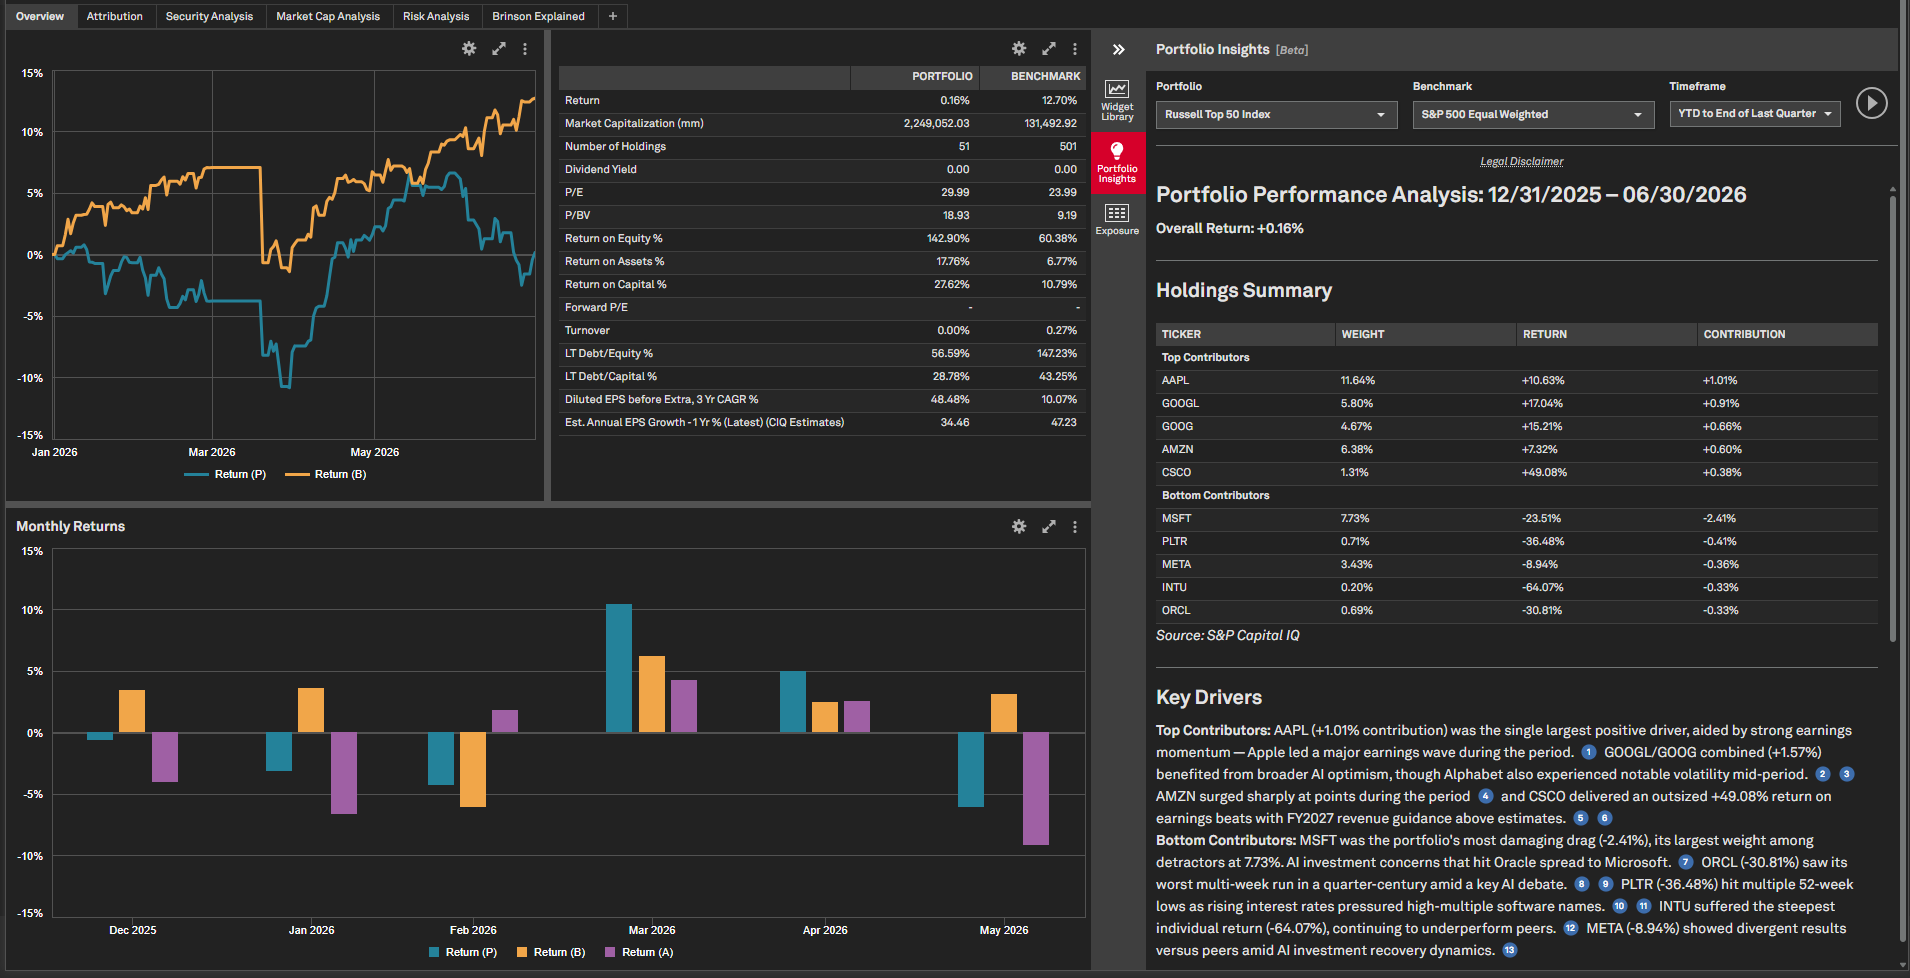
Portfolio Insights introduces AI-powered analysis within Portfolio Analytics, enabling users to explore key drivers of portfolio return and relevant market developments that provide additional context for performance. Insights include news, events, earnings information, risks, and areas to monitor, with links to supporting sources.
Find it in the platform
Navigate to the Portfolios tab from the top navigation
Go to the Reports tab, open a report and navigate to the vertical Widgets bar on the right
Select Portfolio Insights
Choose a portfolio, benchmark, and timeframe
Click Run icon to generate insights
Fixed Income Returns and Equity & FI Overview Featured Report
Portfolio Analytics now enables performance analysis for entitled users across Government, Supranational, Agency, and Corporate fixed income securities, extending return analysis to the fixed income components of blended equity and fixed income portfolios.
To support this expanded fixed income coverage, we introduced the new Equity & FI Overview report, offering a consolidated view for analysing blended portfolios. Users can review overall risk and return, portfolio composition and allocation, equity and fixed income sleeve comparisons, fixed income yield and duration characteristics, performance attribution, and portfolio style relative to a benchmark.
Additionally, fixed income market value and portfolio weight calculations now include accrued interest, providing a more complete view of fixed income positions in portfolio analysis.
Find it in the platform
Navigate to the Portfolios tab in the top navigation
Under Featured Reports, select Equity & FI Overview (New)
Supported fixed income securities are also included in applicable Portfolio Analytics performance reports for entitled users. Market value and portfolio weight calculations automatically incorporate accrued interest for fixed income securities.
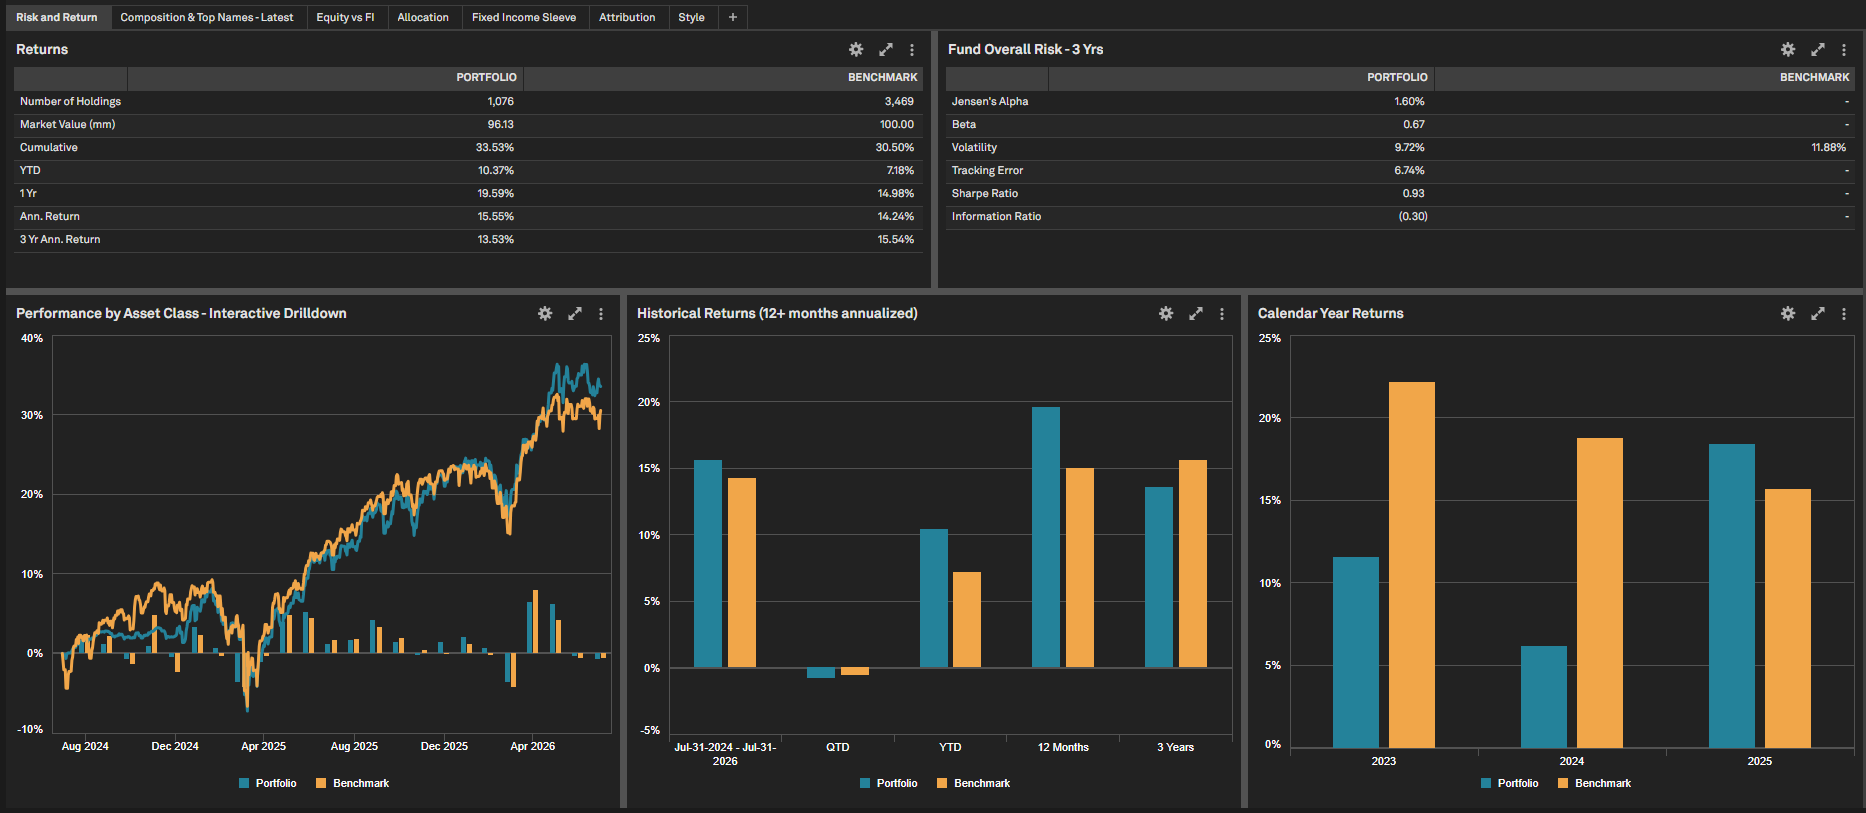
Security Column in Portfolio Exposure
Users can now access a Security column in Portfolio Exposure that displays the individual trading item associated with each holding. This makes it easier to distinguish between individual securities, including multiple fixed income issues from the same company, when analysing aggregated company-level exposure.
Find it in the platform
Navigate to the Portfolios tab in the top navigation
Under Portfolios Analytics, select the Reports tab and open a report
Navigate to the vertical Widgets bar on the right
Click Exposure
Search for a company in the Company search field
View the Security column to identify the individual trading items contributing to the company’s overall exposure

RatingsDirect
In this release, we redesigned the Corporate Profile and Sector Profile experiences in RatingsDirect, enabling users to quickly access relevant credit information, customize their workflow views, and gain quick sector context. We expanded Insurance analytics with newly digitized post-SACP support and additional factor adjustments, providing greater transparency into how external support considerations influence Issuer Credit Ratings for Insurance entities. Additionally, the Outlook Financial Thresholds dataset now includes FOCF-to-Sales where applicable, helping users identify broader triggers that may affect credit ratings.
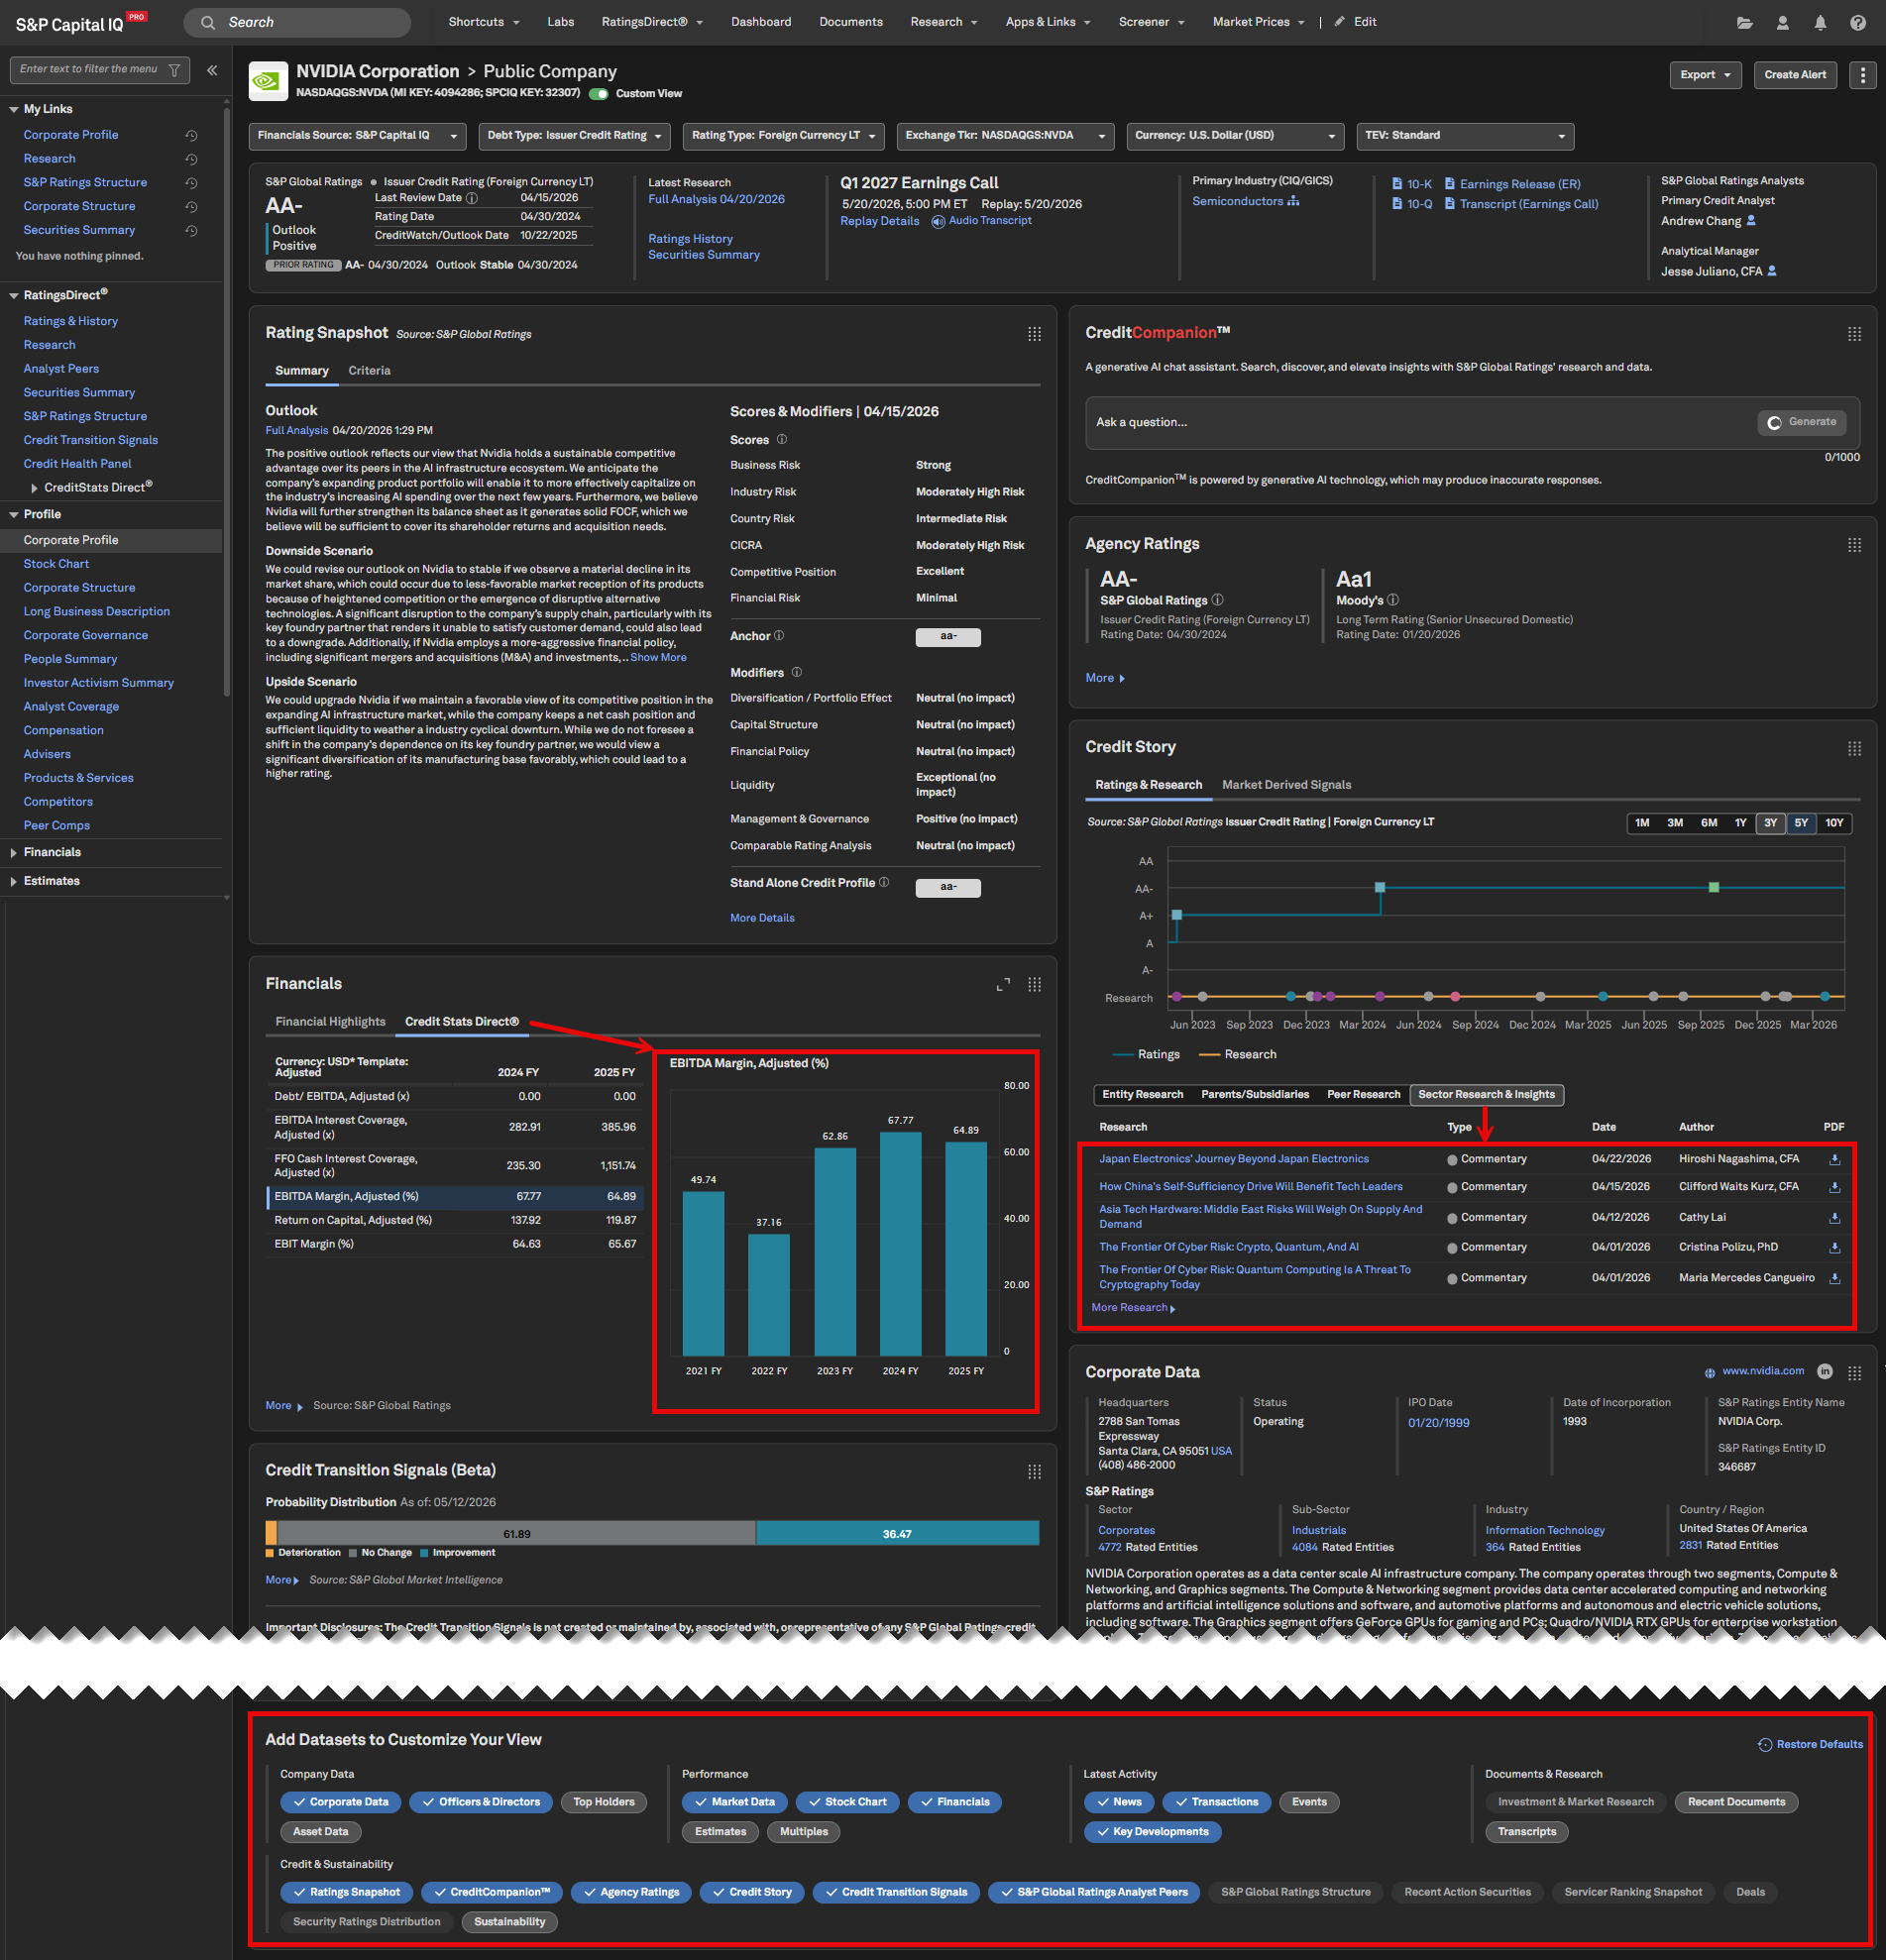
Corporate Profile Enhancements
RatingsDirect users can access the redesigned corporate profile for public and private companies, featuring a cleaner, more flexible layout. They can customize the page to their ideal workflow by adding, removing, and repositioning widgets, making it easier to create a more credit-focused view.
Several widgets are enhanced to improve the presentation of key credit information. Within the Credit Story widget, the Sector Research & Insights tab is more relevant due to AI-enhanced commentary tagging logic that ensures sector‑level research is better aligned to the entity’s subsector. The Ratings Snapshot widget displays Financial Thresholds and Scores & Modifiers in a compact view, providing users immediate visibility into core credit drivers. The Financials widget provides an overview of Capital IQ and CreditStats Direct financials, with the ability to view bar charts for selected metrics.
Find it in the platform:
Search for a covered public or private company in the top search bar and navigate to its Corporate Profile
Note the visually enhanced ribbon and widgets
Select or deselect additional datasets at the bottom of the page
Sector Profile Enhancements
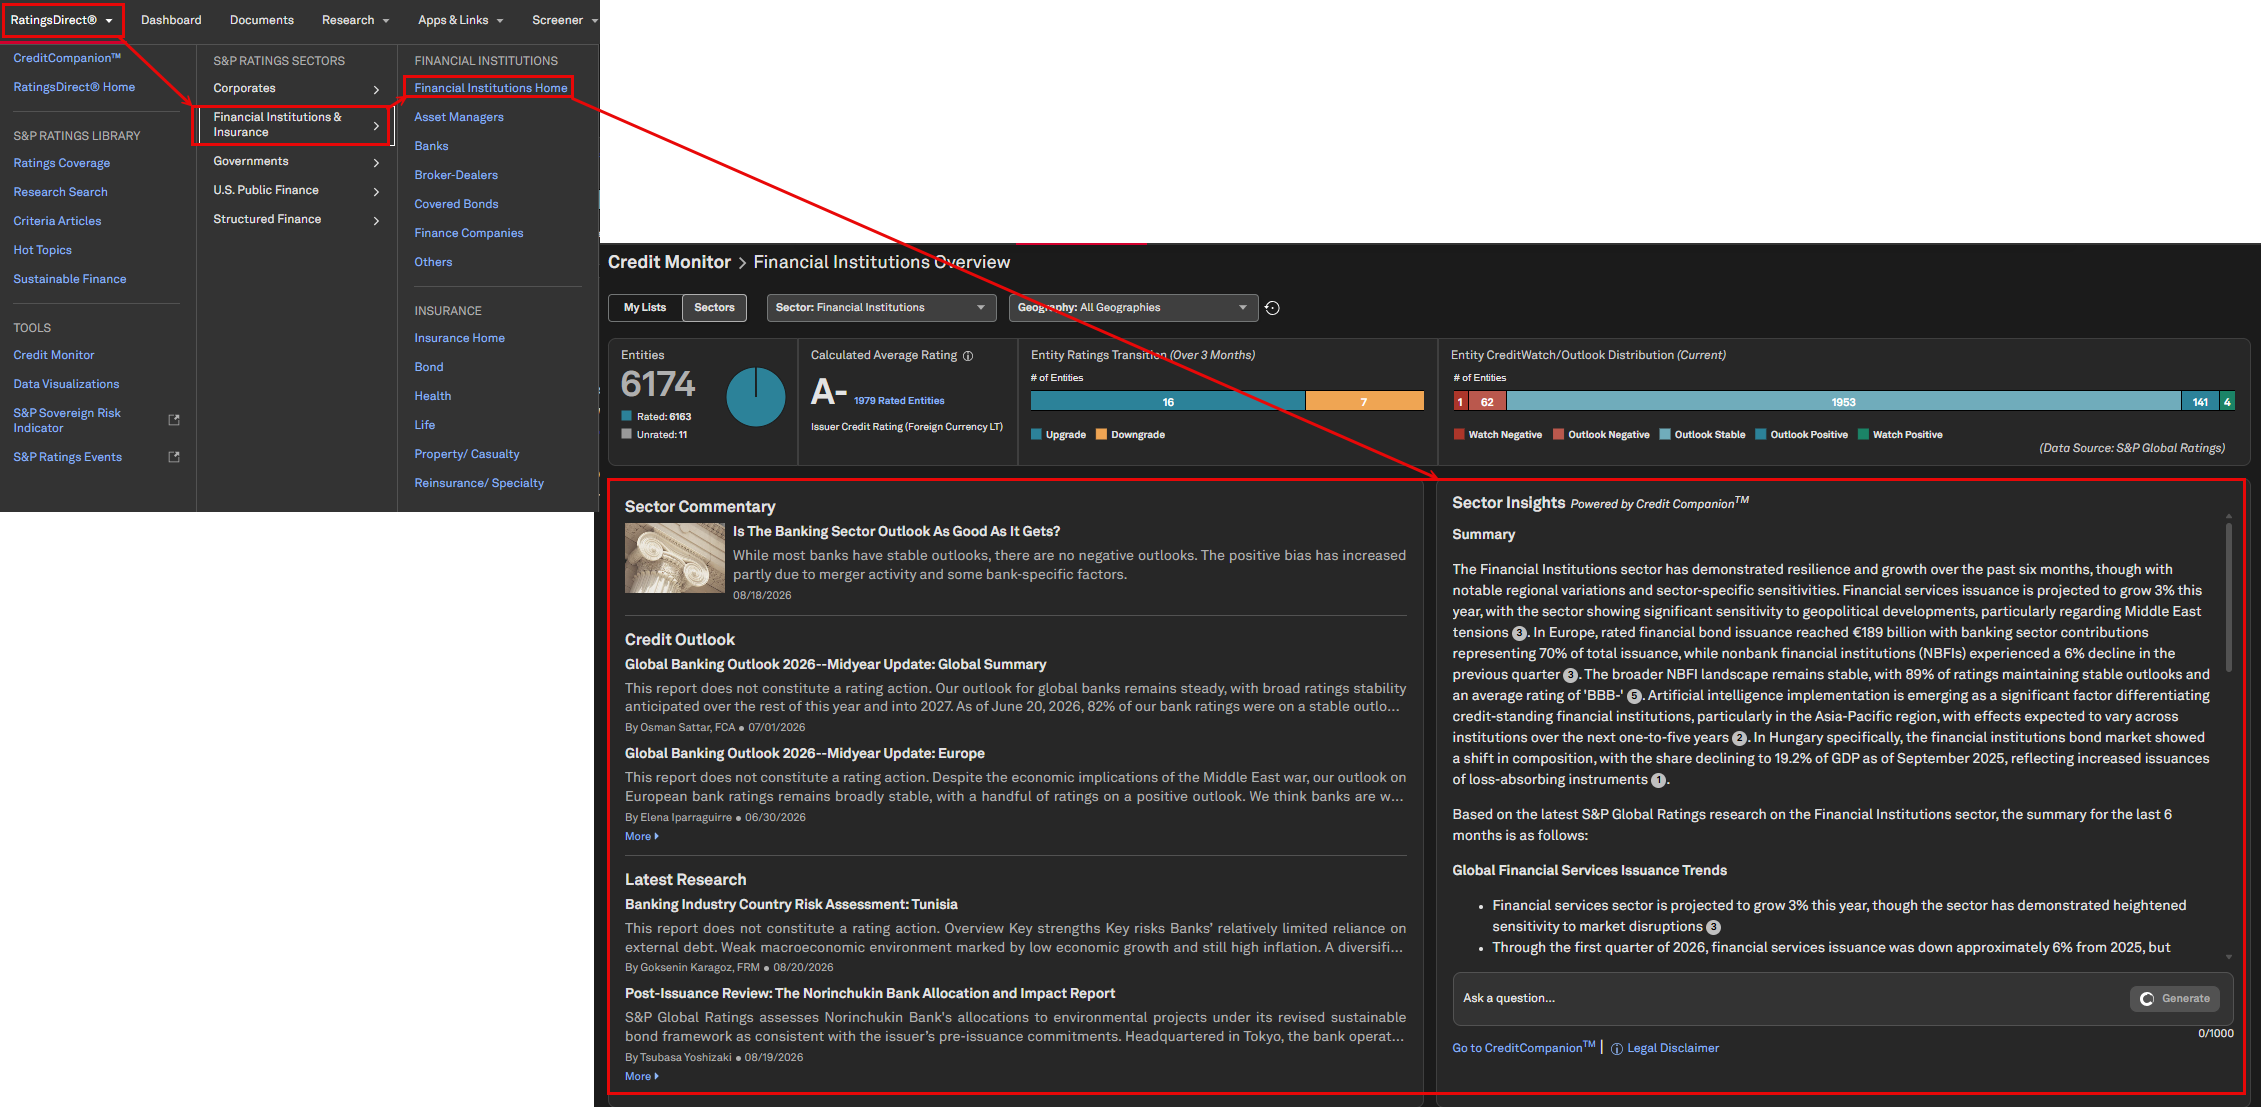
RatingsDirect users can now access a revamped Sector Profile workflow via Credit Monitor or the RatingsDirect top navigation menu. The integrated Sector Profile page leverages the Credit Monitor backbone and features a new Sector Insights widget that displays relevant sector-focused commentary, including a lead report chosen by S&P Ratings, relevant Industry Credit Outlooks, and recent reports tied to the selected sector. Users can navigate to more granular industries or geographies for targeted research.
In addition, a new CreditCompanion powered widget generates an industry overview, enabling users to review relevant research or ask follow-up questions directly within the workflow. This helps credit analysts and portfolio managers reduce manual research effort and incorporate sector-level insights into day-to-day credit analysis.
Additional Credit Monitor widgets surface research and aggregates for issuers in the selected sector, while the Latest Update widget now displays research for revenue sources and securities when relevant.
Find it in the platform:
Navigate to the RatingsDirect
tab in the top navigation, and select a sector from the right column e.g. Corporates HomeOr navigate to the Credit Monitor overview page, select Sectors at the top-left, and choose a sector, sub-sector, or industry
Note: The new Sector Insights widgets will only be visible when a single sector is selected
Insurance post-SACP Support and Additional Factors
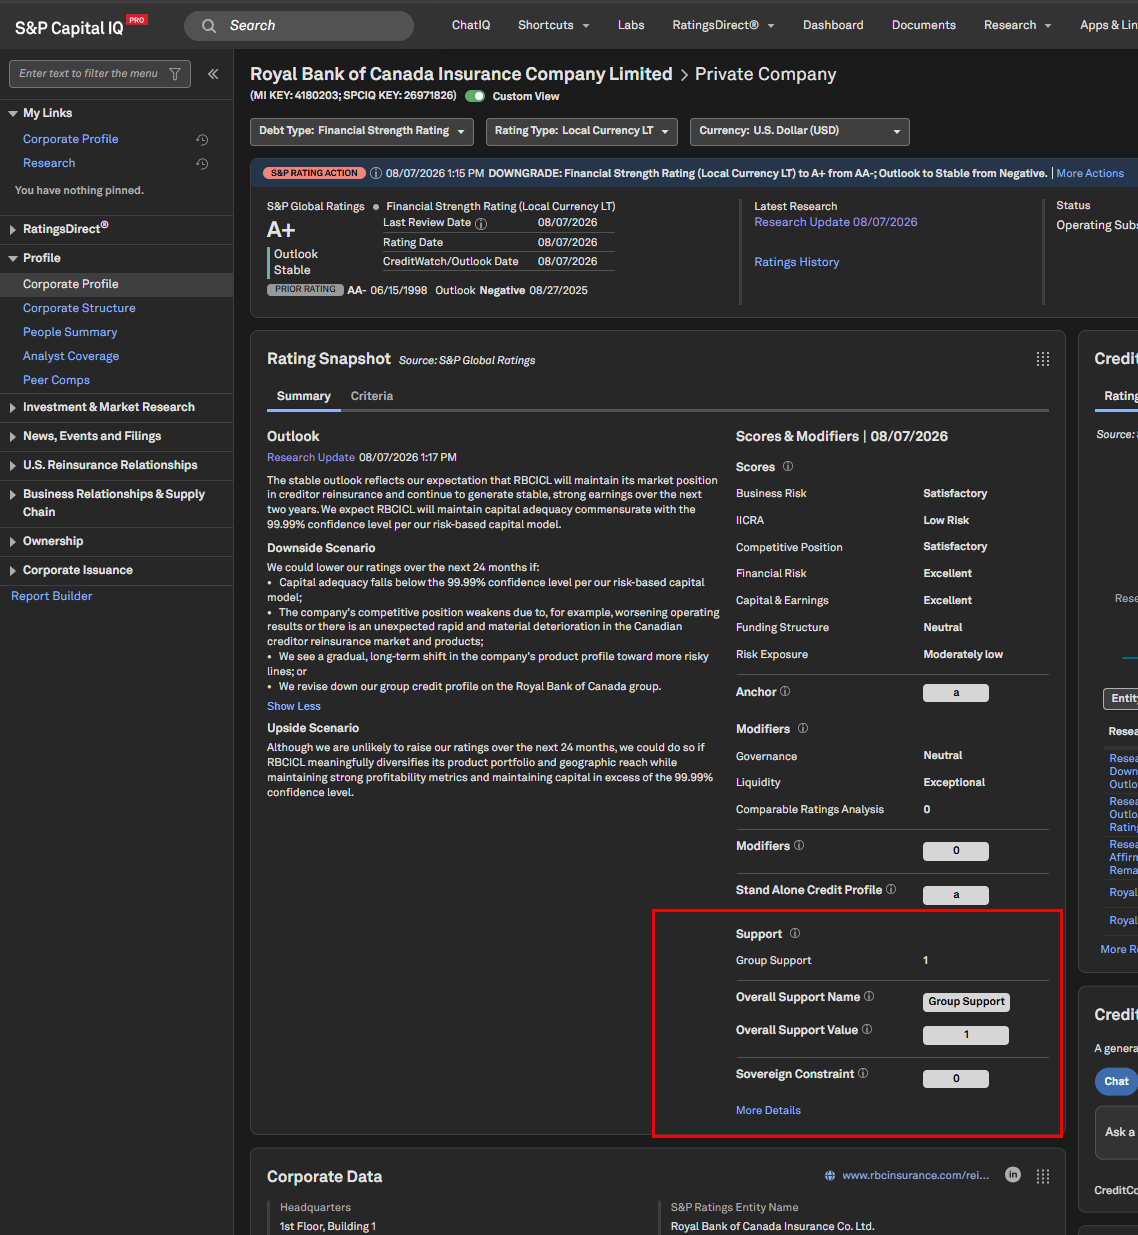
RatingsDirect users can access newly digitized support and additional factor adjustments that S&P Global Ratings considers when evaluating Insurance entities. These adjustments quantify the impact of external support factors from the stand-alone credit profile (SACP) to the potential Issuer Credit Rating, improving transparency into how support considerations influence the final rating outcome. View the Insurers Rating Methodology for more details.
These modifiers can include:
Extraordinary support from a group
Extraordinary support from a guarantor
Extraordinary support from a government or government-related entity
Sovereign-related constraints
Find it in the platform:
Corporate Profile
Search for and select a rated insurer from the top search e.g. NYSE:EQH
Navigate to the Corporate Profile and access the Ratings Snapshot widget, and notice the Support section
Screener
Navigate to Screener from the top navigation or the Apps & Links menu and select Companies Screener
Under Browse Criteria, select Company Details > Issuer Ratings > S&P > Scores & Factors > Insurance > Support
S&P Capital IQ Pro Plug-In
In Excel, launch S&P Capital IQ Plug-in and open Formula Builder
Under Data Items, select Company Details > Issuer Ratings > S&P > Scores & Factors > Insurance > Support
Outlook Financial Threshold Coverage
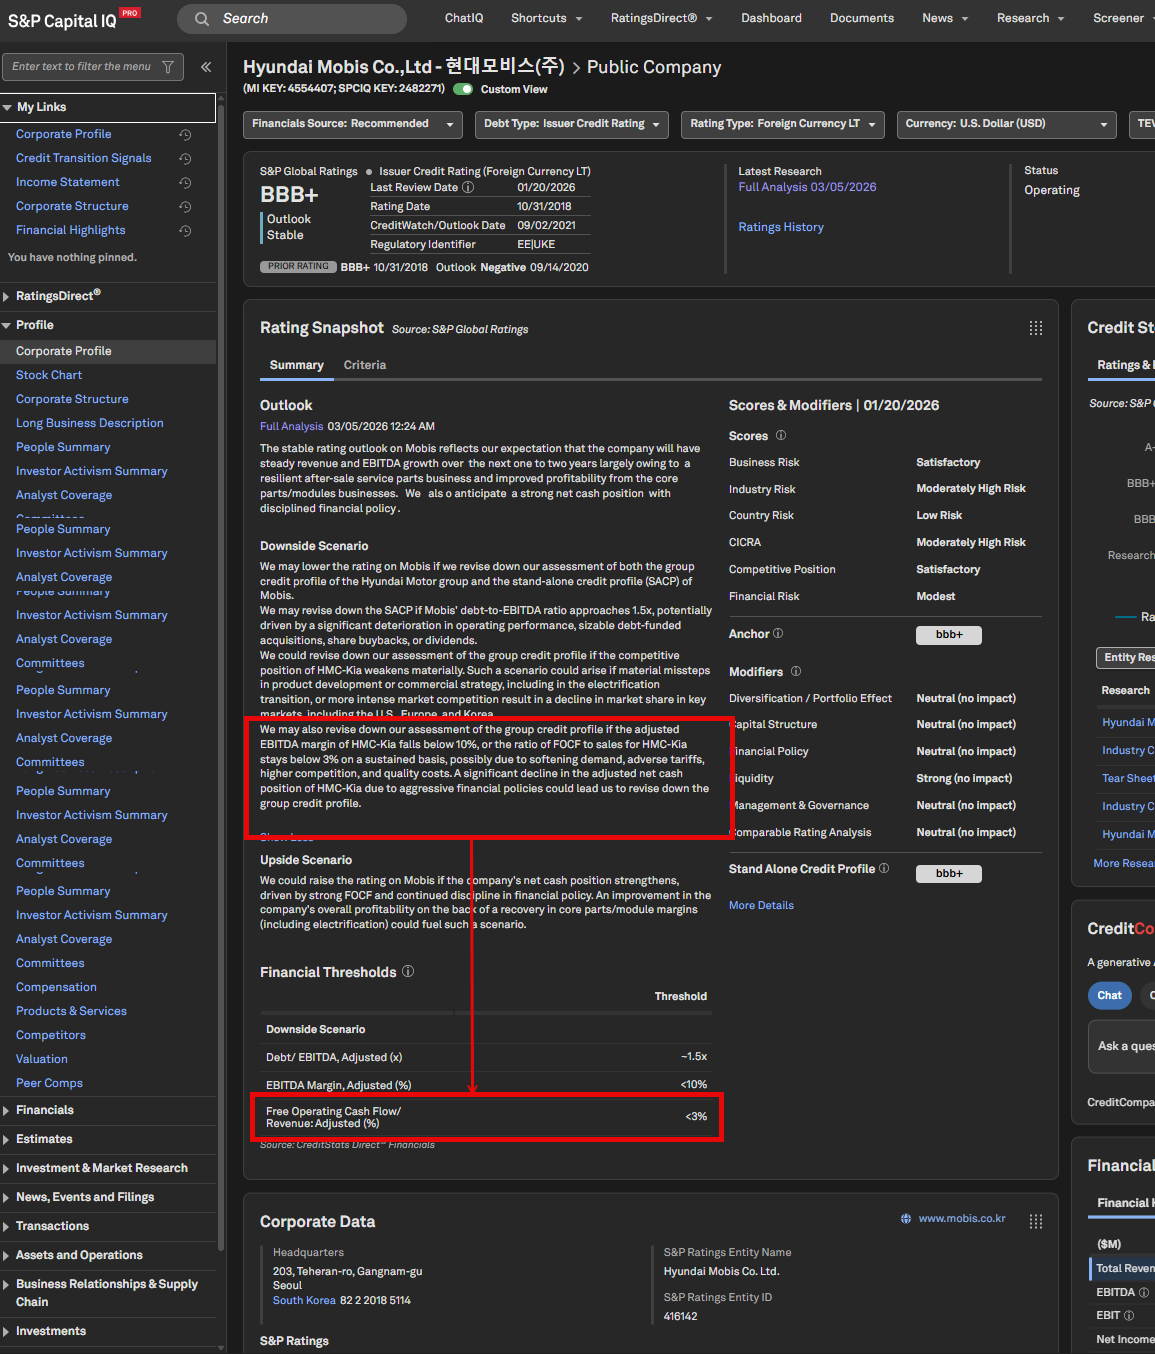
Outlook financial threshold coverage is expanded to extract and present Free Operating Cash Flow (FOCF)-to-Sales thresholds when reported in an entity's Full Analysis or Research Update reports. S&P Ratings often considers FOCF-to-Sales when evaluating entities in the automobile industry.
Find it in the platform:
Search for and select a rated insurer from the top search e.g., Honda
Navigate to the Corporate Profile and access financial thresholds displayed in the Rating Snapshot widget
Or navigate to the Credit Monitor Entity View and select the Outlook Financial Thresholds tab
Credit Memo Builder
In this release, we enhanced Credit Memo Builder throughout the memo creation workflow, improving content quality, source transparency, and confidence in AI-generated outputs. Quality Scores Beta, expanded citation support for proprietary documents, improved OCR and Vision AI capabilities for proprietary documents, and clearer section source visibility help users better evaluate generated content, trace statements back to supporting materials, and make more informed review decisions.
Users also have more flexibility to tailor, reuse, and analyze memo content through shared templates, template-level prompt configuration, expanded data sources, Excel table exports, and targeted regeneration of individual sections. Together, these enhancements reduce manual rework, promote greater consistency across teams, and support richer, more efficient credit analysis workflows.
Quality Scores (Beta)
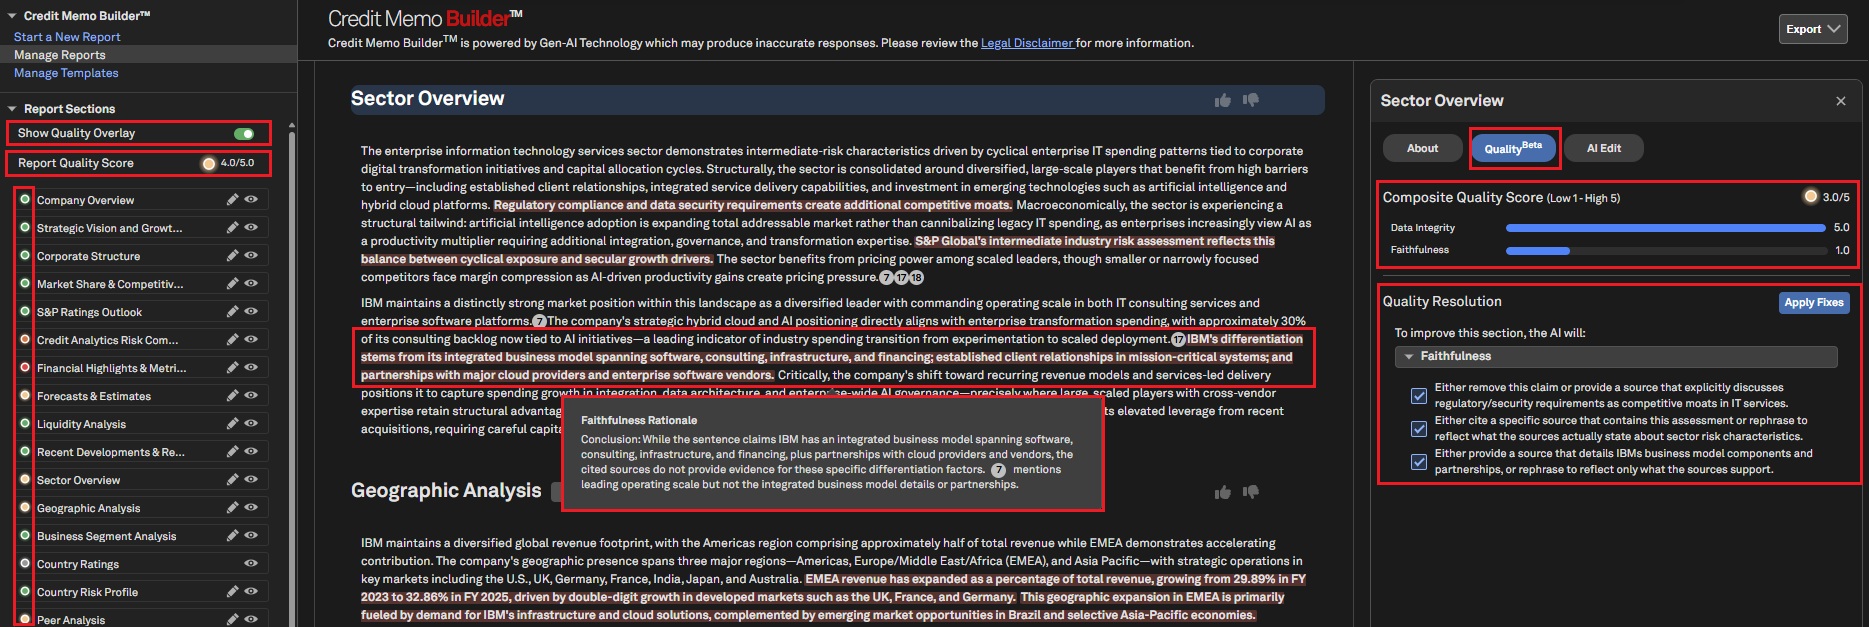
Quality Scores (Beta) helps users evaluate AI-generated credit memo content by highlighting sections that may require additional review. When enabled, the feature assigns quality scores to eligible memo sections based on data integrity and faithfulness, providing greater transparency into content quality. Color-coded indicators, flagged sentences, and explanatory rationale help users quickly identify potential issues and focus their review on areas that may need attention. For sections with lower scores, the feature also provides suggested fixes that can be applied directly to improve quality and increase both section-level and overall memo scores. Quality Scores are designed to support, not replace, user analysis and should always be used alongside professional judgment.
Find it in the platform:
Navigate to the RatingsDirect menu from the top navigation, select CreditCompanion and then click the Credit Memo Builder tile
Alternatively, navigate to the Credit Analytics menu from the top navigation and select Credit Memo Builder
In the left-hand Report Sections pane, click on the Show Quality Overlay toggle to activate it
View the overall Report Quality Score in the Report Sections pane, as well as the individual color indicators for each section
For a specific section, select the QualityBeta button to open the right-hand pane and view the section quality, flagged sentences, reasoning, and possible fixes
Note: Access to Credit Memo Builder requires an additional subscription. Please contact your account team for details.
Proprietary Document Enhancements
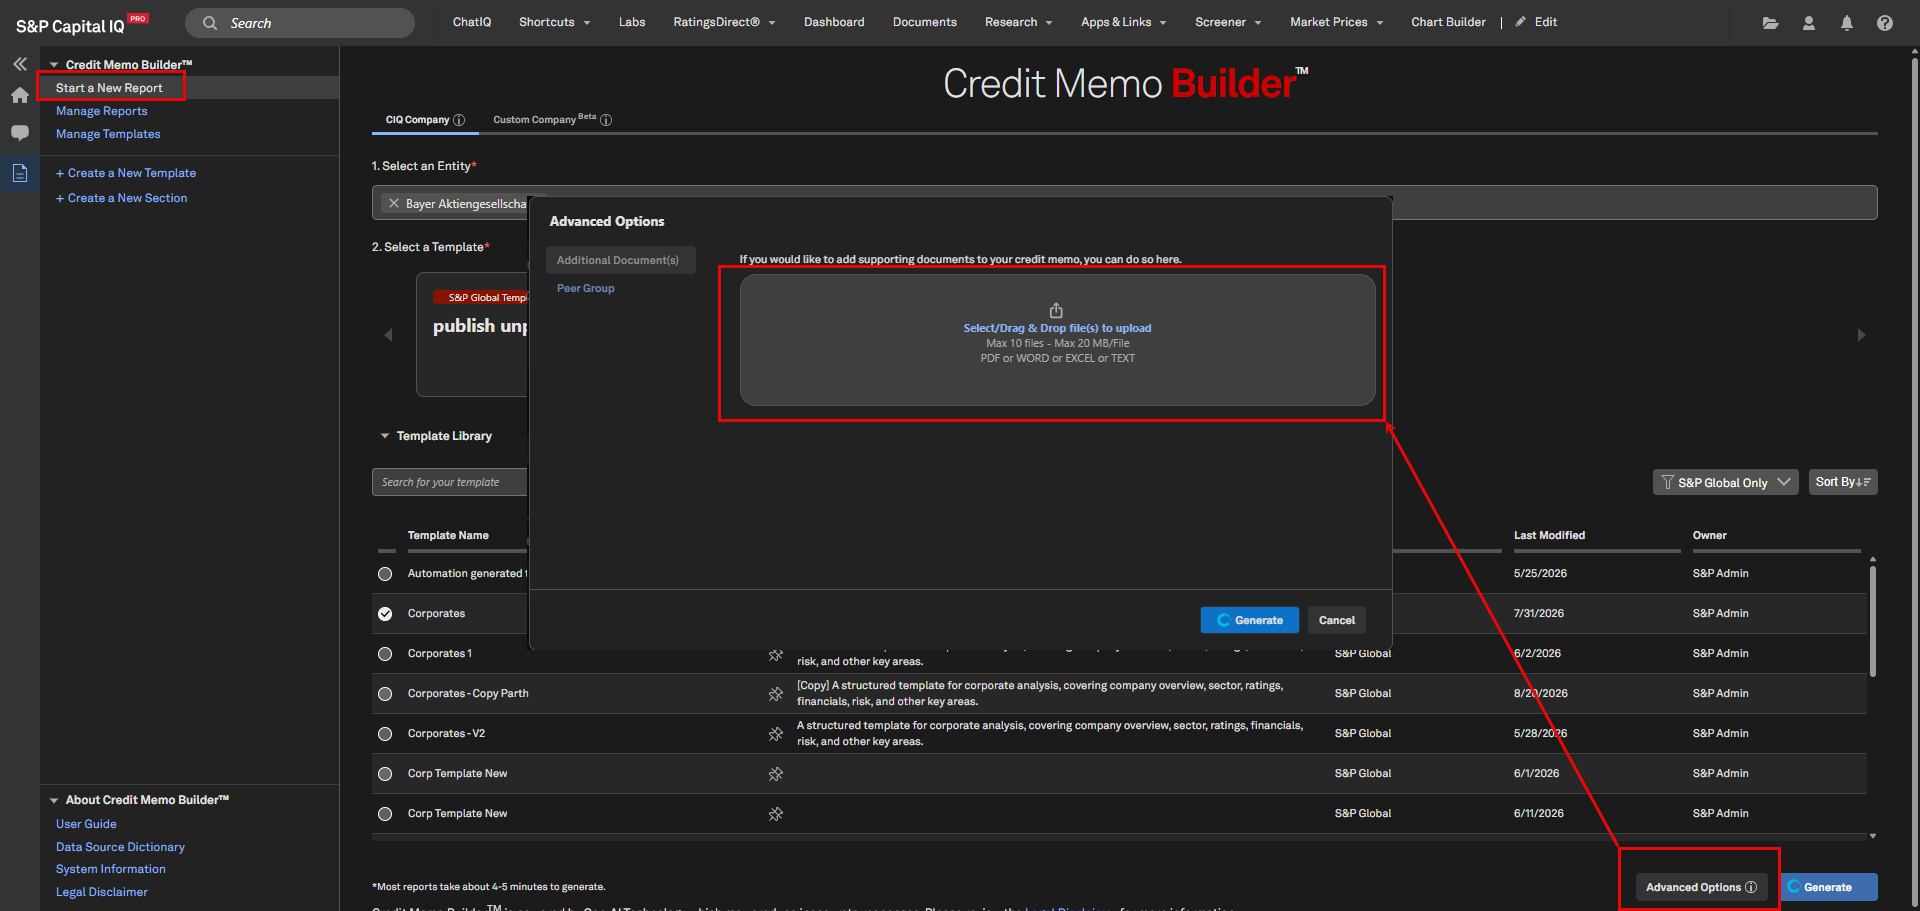
Users can now see improved citation support for uploaded proprietary documents. This enhances transparency by helping users trace AI-generated statements back to relevant uploaded source material, consistent with Credit Memo Builder’s focus on inline citations and source excerpts.
In addition, uploaded documents benefit from improved recognition and support for charts, tables, and images, with enhanced OCR capabilities that extract and interpret content from scanned and image-based documents, expanding the range of proprietary documents available for memo generation.
Moreover, users can now use Vision AI to extract insights from visual content, including charts, graphs, tables, and embedded images in uploaded documents.
Find it in the platform:
Navigate to the RatingsDirect menu from the top navigation, select CreditCompanion and then click the Credit Memo Builder tile
Alternatively, navigate to the Credit Analytics menu from the top navigation and select Credit Memo Builder
Select Start a New Report from the left-hand navigation
At the bottom right, click Advanced Options
Select or drag and drop files to upload
Note: Access to Credit Memo Builder requires an additional subscription. Please contact your account team for details.
Export All Tables to Excel
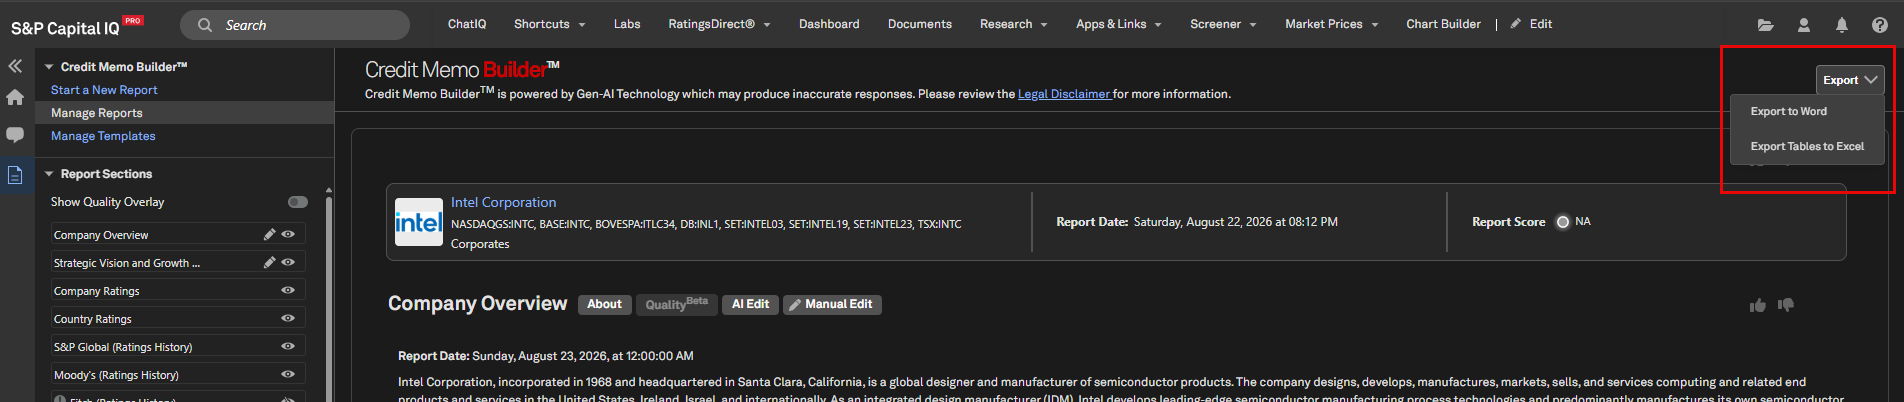
Users can now export all tables from Credit Memo Builder reports into Excel for additional review, analysis, and sharing. This makes it easier to work with generated financial and analytical tables outside the memo while preserving flexibility for downstream workflows.
Find it in the platform:
Navigate to the RatingsDirect menu from the top navigation, select CreditCompanion and then click the Credit Memo Builder tile
Alternatively, navigate to the Credit Analytics menu from the top navigation and select Credit Memo Builder
Click the Export option at the top-right, and then select Export Tables to Excel
Note: Access to Credit Memo Builder requires an additional subscription. Please contact your account team for details.
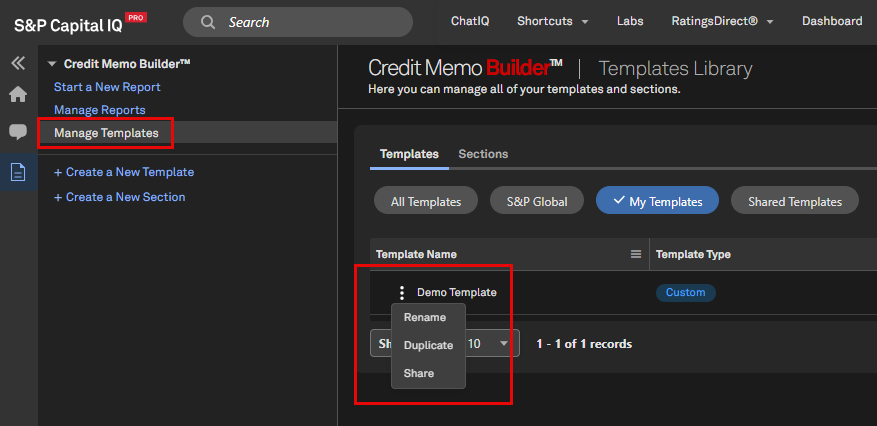
Sharing Templates
Users can now share Credit Memo Builder templates and sections across users and teams. This helps organizations standardize memo structures, reduce duplication, and promote consistency across credit workflows.
Find it in the platform:
Navigate to the RatingsDirect menu from the top navigation, select CreditCompanion and then click the Credit Memo Builder tile
Alternatively, navigate to the Credit Analytics menu from the top navigation and select Credit Memo Builder
Click the Manage Templates page from the left-hand navigation, and select either the Templates or Sections tab
To the left of the template or section name, click the three-dot icon and select Share
Note: Access to Credit Memo Builder requires an additional subscription. Please contact your account team for details.
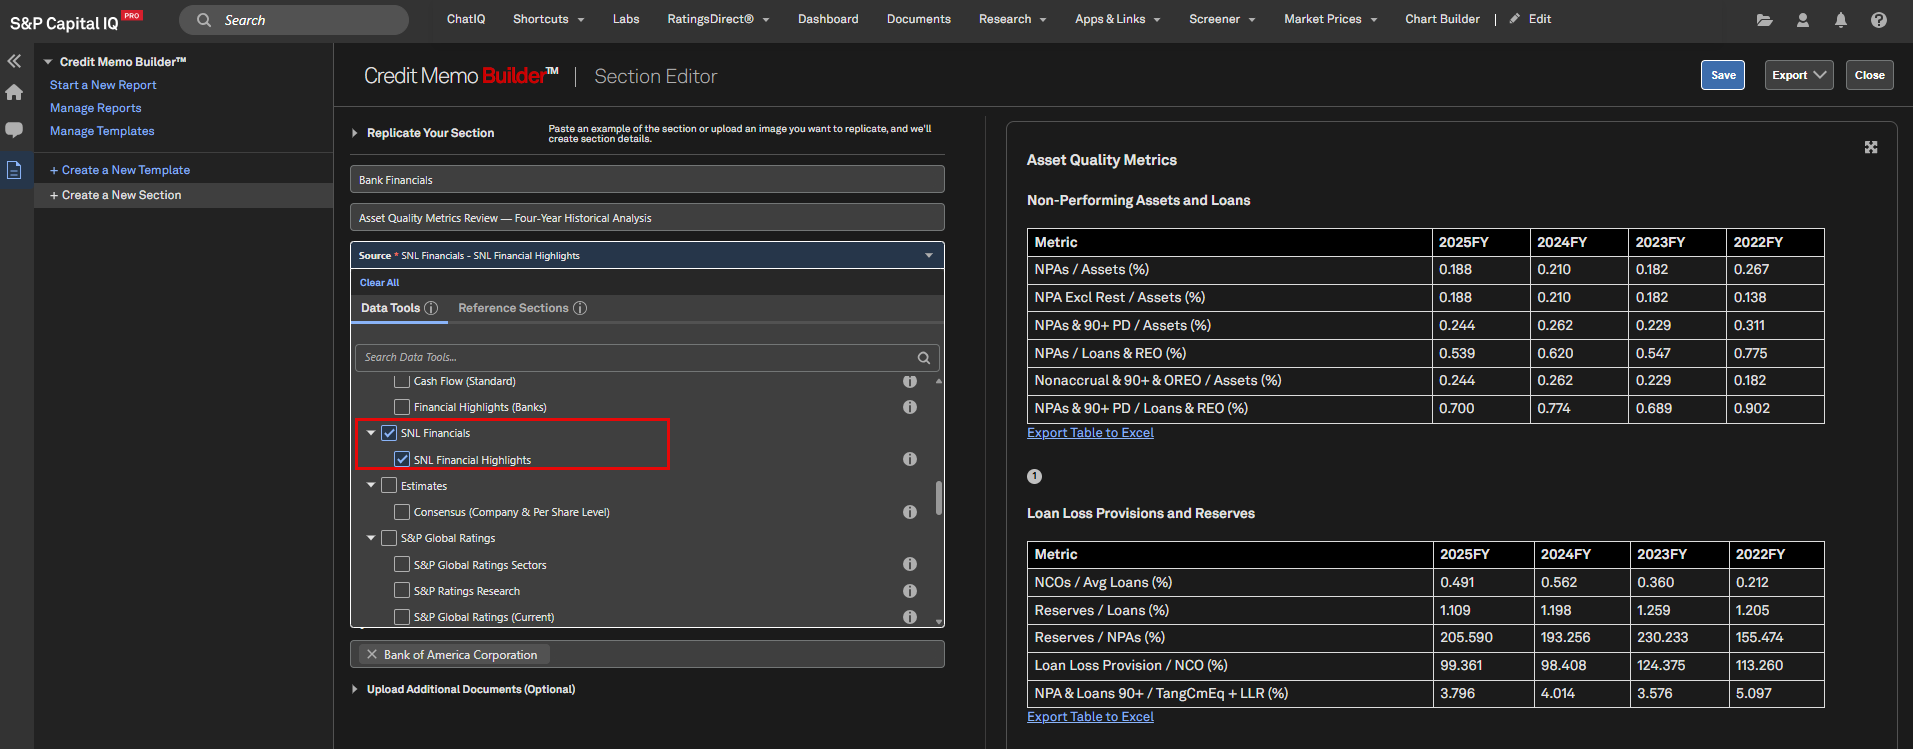
New Data Sets
Users can now access an expanded set of data sources within Credit Memo Builder, including SNL Financial Highlights, Market Intelligence News, expanded Estimates at the company and share levels, and S&P Ratings analyst peers, where available and licensed.
Find it in the platform:
Navigate to the RatingsDirect menu from the top navigation, select CreditCompanion and then click the Credit Memo Builder tile
Alternatively, navigate to the Credit Analytics menu from the top navigation and select Credit Memo Builder
Click Create a New Section page from the left-hand navigation
On the Create a New Section page, or when editing an existing section, find the new sources under the Source dropdown
Note: Access to Credit Memo Builder requires an additional subscription. Please contact your account team for details.
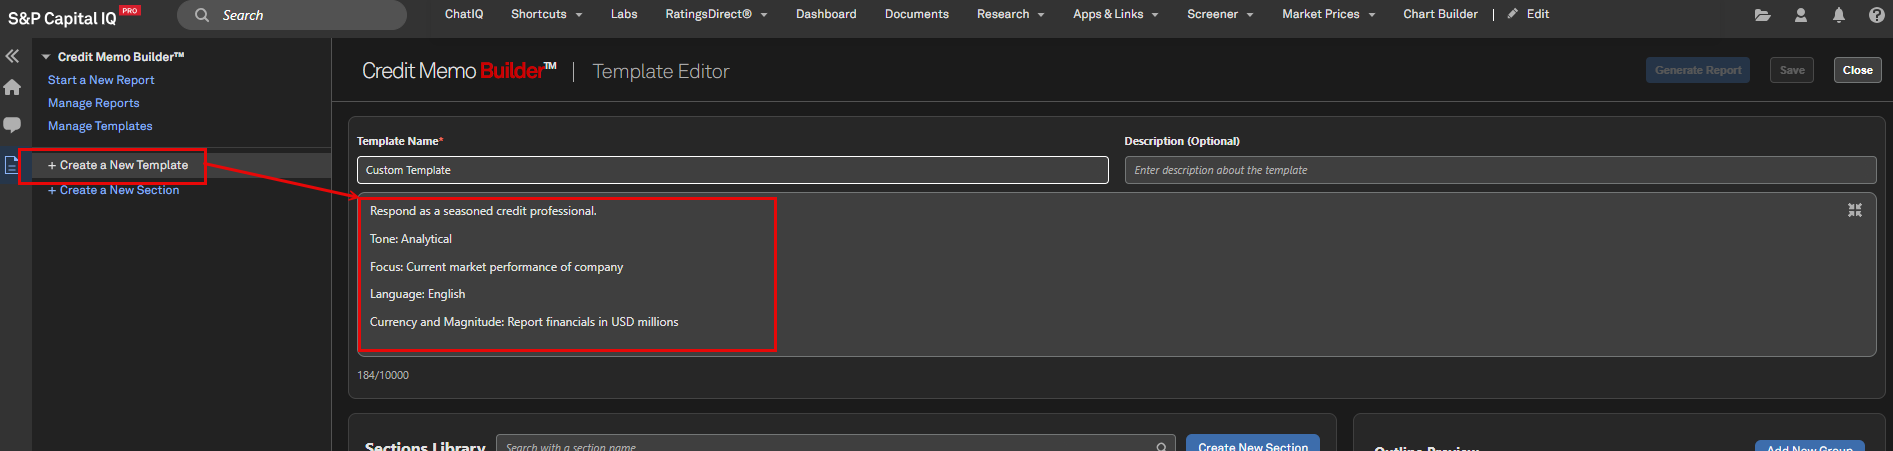
Template-Level Prompt Configuration
Users can now configure prompts at the template level so that style, language, currency, and other drafting preferences carry across memo sections. This produces more consistent outputs aligned with internal credit memo standards while reducing repeated prompt setup.
Find it in the platform:
Navigate to the RatingsDirect menu from the top navigation, select CreditCompanion and then click the Credit Memo Builder tile
Alternatively, navigate to the Credit Analytics menu from the top navigation and select Credit Memo Builder
Click Create a New Template in the left-hand navigation or edit an existing template
Enter any template-level configurations in the prompt box at the top of the page
Note: Access to Credit Memo Builder requires an additional subscription. Please contact your account team for details.
Additional Usability Enhancements
Users can leverage the following additional usability enhancements.
Enhanced landing page now offers search and pin-to-favorites functionality for faster access
AI-powered editing enables direct modifications to charts and data sources
Regenerate individual memo sections without the need to regenerate an entire memo
Automatic language detection ensures consistent formatting and supports seamless multilingual editing
Generate memo sections with greater awareness of related content elsewhere in the same template, improving narrative cohesion across templates
Chart editing capabilities expanded to include color and legend customization
Improved visibility into section data sources and entitlements, empowering users to understand content generation dependencies
Note: Access to Credit Memo Builder requires an additional subscription. Please contact your account team for details.
S&P Capital IQ Pro Plug-in
In this release, we introduced the SPGAVAIL( function in the S&P Capital IQ Pro Plug-in to streamline formula creation and model optimization.
SPGAVAIL( Function
Users can now utilize =SPGAVAIL( function instead of general =IF( statements to simplify formulas and optimize model performance. There is no need for complex IF statements to check for NULL values, as the =SPGAVAIL( function automatically detects NULL values, regardless of NULL settings such as NA, 0, or others.
Find it in the platform:
In Excel, launch S&P Capital IQ Pro Plug-in
Use =SPGAVAIL(SPG(“Formula checking for NULL"),SPG("Formula that would replace NULL"))
Example: =SPGAVAIL(SPG("NASDAQGM:ONCH","IQ_TOTAL_REV","FY2025"),SPG("NASDAQGM:ONCH","IQ_INTEREST_INVEST_INC","FY2025"))
This formula returns total revenue for the specified company and year, or if that value is NULL, it returns the interest investment income
Mobile App
In this release, we enhanced the S&P Capital IQ Pro Mobile experience with modern navigation, providing seamless access to the industry’s most essential intelligence on the go.
Version Numbers:
iOS: 2.23.X
Android: 2.29.X
Scan the QR Code:
New Mobile Navigation Experience
The enhanced mobile navigation makes it easier and faster for users to access key features and essential intelligence on S&P Capital IQ Pro.
iOS Glass Navigation: The updated design offers quicker, more modern access to key app areas, enhancing usability and reducing navigation friction.
Bottom Navigation Reference: Now available on both iOS and Android, this clean and familiar navigation pattern simplifies the discovery and engagement with critical features.
Find it in the Mobile App:
Log in to the Capital IQ Pro Mobile App
Access major sections using the new bottom navigation bar
iOS users will notice improved transitions and a more modern interface
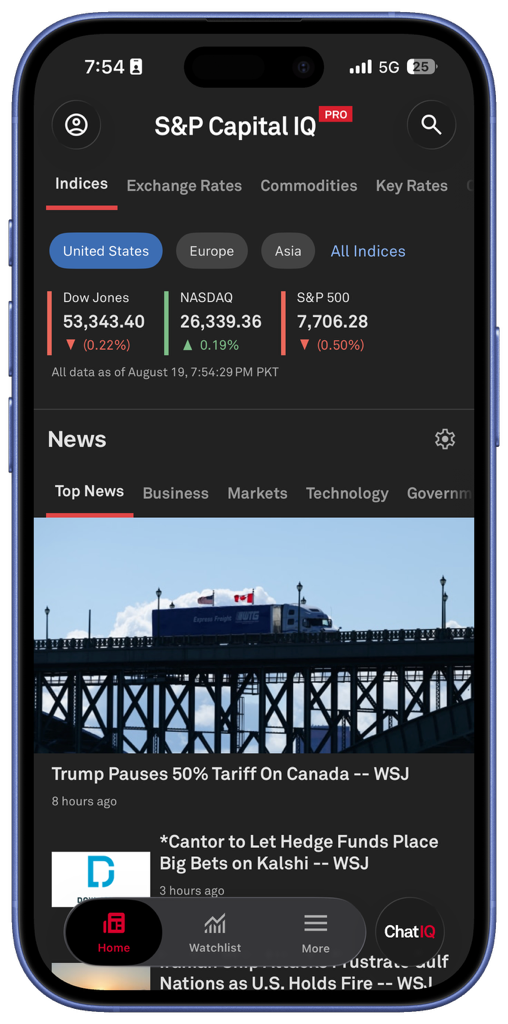
Single Sign-On (SSO) Integration
Enterprise users can now have instant, secure access to S&P Capital IQ Pro on the mobile app using their corporate credentials via Okta—eliminating repeated logins for a seamless experience from any device, anywhere.
Find it in the Mobile App:
Log in to the Capital IQ Pro Mobile App
Single Sign On is available on the login screen, which supports enterprise authentication protocols