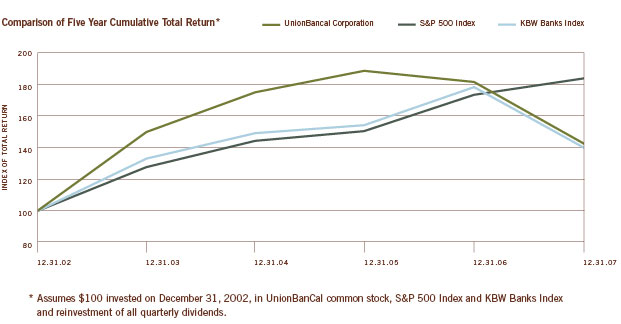
Common Stock Performance Graph
The following line graph compares the yearly percentage change in the cumulative total stockholder return on UnionBanCal common stock with the cumulative total return of the Standard & Poor’s 500 Stock Index and the KBW Banks Index, published by Keefe, Bruyette & Woods, Inc., for the five-year period commencing December 31, 2002. The stock price performance depicted in the Performance Graph is not necessarily indicative of future price performance.
