Net Income (per common share)
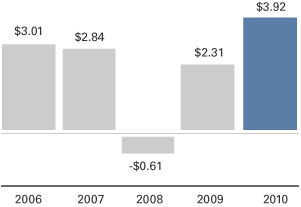
Results in 2010 continue a strong growth trend with 2010 net income of $120.7 million, or $3.92 per share. The net loss in 2008 reflects realized investment losses from other-than-temporary impairments of bonds in the investment portfolio.
Operating Income (per common share)
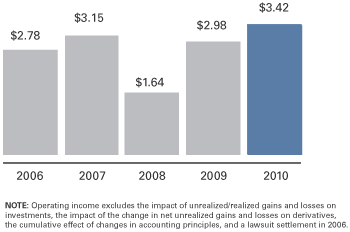
Operating income remained strong in 2010, totaling $105.2 million – a record $3.42 per share - reflecting sound fundamentals of both Farm Bureau Life and EquiTrust Life.
Capitalization
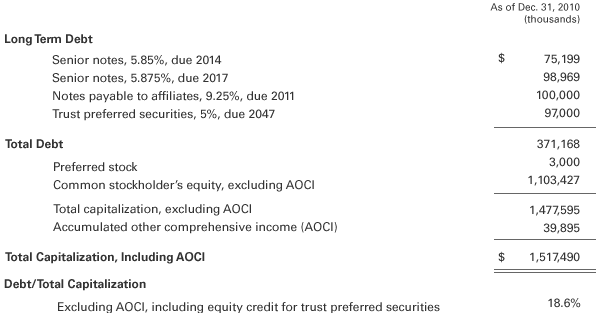
FBL’s total capitalization exceeds $1.5 billion, an increase from $1.2 billion at year end 2009. The debt-to-total capitalization ratio, with equity credit for trust preferreds, was 18.6% at year end with securities at cost.
Statutory Capital
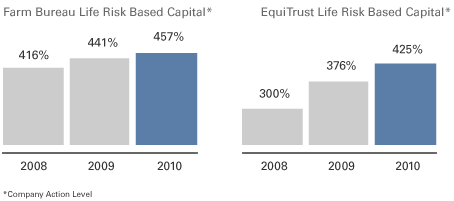
Farm Bureau Life and EquiTrust Life are well-capitalized with excellent company action level risk based capital ratios of 457% for Farm Bureau Life and 425% for EquiTrust Life.
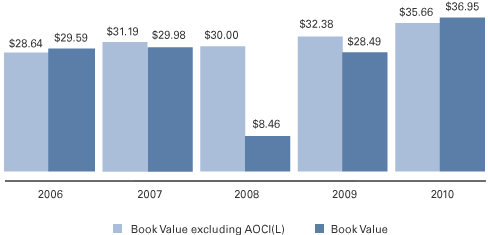
Book Value
GAAP book value grew by 30% in 2010 reflecting strong earnings and improving investment valuations.
Investments By Type
At December 31, 2010, FBL’s investments totaled $13.1 billion and are well diversified by individual issue and industry.

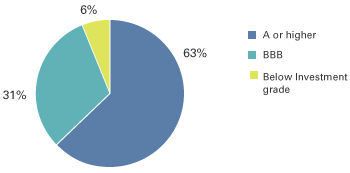
Investments By Quality
FBL's investment portfolio quality is high with 94% of the securities being investment grade.
© 2011 FBL Financial Group, Inc.

