Chief Financial Officer
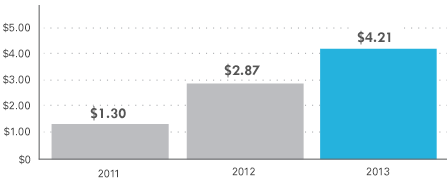
Net Income per common share
Record net income per share and operating income per share was achieved in 2013, reflecting steady and consistent growth from Farm Bureau Life and capital management actions taken over the last few years. 2011 net income was negatively impacted by a $2.43 per share loss related to the sale of EquiTrust Life Insurance Company and related debt redemption. This subsidiary was sold in 2011 to reduce risk of the overall enterprise, increase financial flexibility and enable capital management.
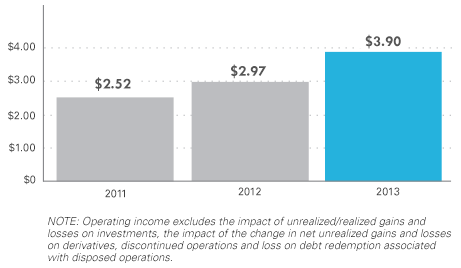
Operating Income per common share
Operating income grew in 2013 to an all-time high of $100.6 million, or $3.90 per share, reflecting the growing business of Farm Bureau Life, spread management and execution of capital management strategies.
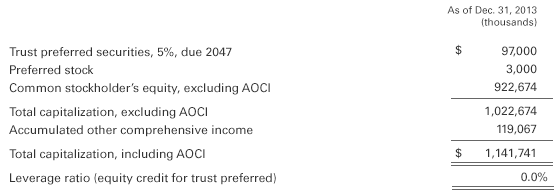
Capitalization
FBL’s total capitalization is $1.1 billion. Farm Bureau Life consistently generates excess capital, with excess capital estimated to be $160 million at year end 2013.
Statutory Capital
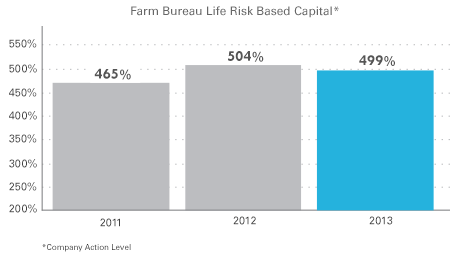
Farm Bureau Life’s capital position remains very strong, even with 2013 dividends of $140 million from Farm Bureau Life to the holding company to support capital transactions. FBL’s company action level risk based capital, or RBC*, ended 2013 at 499%.
Book Value per common share
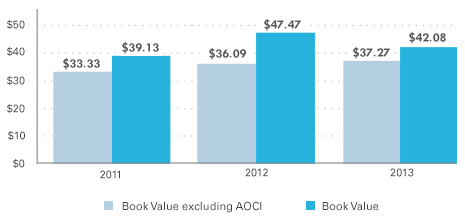
FBL’s book value per share was impacted by a $2.00 per share special dividend paid in the third quarter of 2013, yet book value, excluding AOCI, grew by 3% in 2013.
Investments By Type
At December 31, 2013, FBL’s investments totaled $7.0 billion and are well diversified by individual issue and industry.

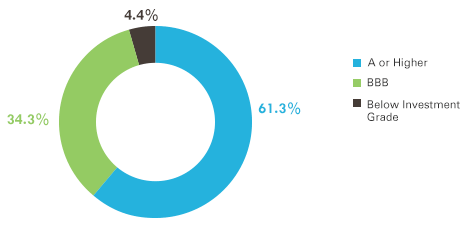
Investments By Quality
FBL's investment portfolio quality is high with 96% of the fixed maturity securities being investment grade.
