Electric Power News and Market Data
 SNL Energy provides in-depth
company and asset-level coverage of the North American power industry. We combine
diverse information sources into a cohesive, instantly accessible decision-support
platform. Whether you are a strategic or financial analyst, SNL Energy’s flexible
product gives you the ability to tailor information to your needs.
Integrated data, news and analytics.
Standardized briefing books combine financial and operational data, documents and
news into a useful summary of companies and power plants. Our Excel Add-in provides
immediate access to robust data and templated reports, including an extensive library
of customizable Excel templates for power industry analysis and benchmarking. Our
power sector coverage includes the following:
- Electric Utilities Operational Statistics (3,200+ IOU, Municipals, Public Authorities,
& Cooperatives EIA 861) - Energy Holding Companies Financial Results (200+ SEC Filers)
- Regulated Energy and Utility Company Financials (1,100+ FERC Form 1, RUS 7 & 12 Filers)
- Market Prices (SNL Indexes, CME/NYMEX, 9 ISOs)
- Daily Assessments
- Futures/Forwards
- Day Ahead/Hour Ahead LMPs, Congestion, Losses, Loads
- Power Plant Financials and Operations (9,000+ Plants)
- 19,000+ Operating Units
- Project Development Tracking
- Power Projects (2,300+ Plants)
- Transmission Projects
- Environmental Control Projects
- Mergers & Acquisitions
- League Tables
- Asset-level Transactions (Power Plants)
- Company-level Transactions
- Supply and Demand Fundamental Statistics
- NERC and NERC Subregion Demand Forecasts (EIA 411)
- Planning Area Hourly Loads (FERC 714)
- Regional Historic and Future Power Plant Capacity


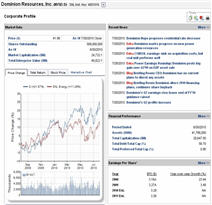
Get a comprehensive view of a company’s financial and operational data, critical documents and timely news. Information and data from various sources are combined into one location for powerful analysis of an organization.
- Quickly understand a company’s corporate structure.
- Evaluate a company’s financial and market position over multiple years or quarters.
- Detailed capital structure reports provide a complete view of a company’s long term obligations, capital costs and credit ratings.
- Asset lists inventory all operating and planned power plants as well as transmission and gas projects.
- One-stop location for source documents and investor presentations.
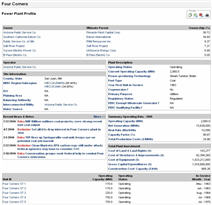
View plant and unit operating parameters, related news and documents, with financial and operational statistics into a comprehensive power plant profile.
- Quickly analyze a power plant’s operations over time including generation, heat rate, emission controls, and production costs.
- Monitor the status and development of new power plant projects.
- Evaluate the costs and trends of power plant fuel purchases.
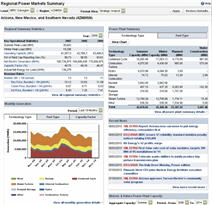
Our Regional Power Market Summary (RPMS) aggregates financial and operational statistics for electric regional areas. RPMS compiles unit, plant and company-level statistics in an interactive summary of the NERC Regions, NERC Subregions, Balancing Authorities, Planning Areas, and ISOs.
- Compare regional revenue rates and financial statistics for each company to the regional average.
- Analyze the current, planned and under construction power plants by technology and/or fuel types.
- View monthly generation by technology and/or fuel type as compared to the fleet capacity breakdown.
- Evaluate the volume of fossil fuel purchases under spot vs. contract as well as the source basin for each coal plant.
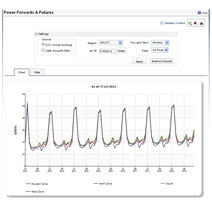
Gain access to proprietary daily assessments; ISO day-ahead, hour-ahead, and hourly real-time prices; OTC Global Holdings 7-year forwards at major natural gas and power locations; and CME/NYMEX forwards, futures, and swaps. These data are available through the web interface and the Excel Add-In.
- Integrate SNL Energy’s commodities data into your own Excel models with auto-refresh capabilities to stay current.
- Create customizable watch lists for efficient tracking and analysis of multiple markets.
- Instantly view pricing data for coal, natural gas, electricity, heating oil, crude oil, and emissions.
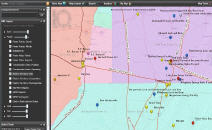
SNL Energy’s mapping application combines powerful visualization tools with multiple layers of essential energy infrastructure assets, integrated with our online platform.
- Create company footprint maps for pitch book or reports.
- Geographically illustrate the results of M&A activities.
- Locate existing and proposed energy infrastructure.
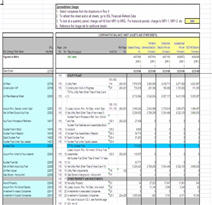
Customizable Excel templates provide a wide range of tools for analysis, from a simple summary of power plants owned to a more complex collection of peer analysis tools, or add years of historical data to create tailored reports.
- Power Plant Capacity by Owner Summary: Aggregates plant capacities to the ultimate parent-level with filter on fuel type, location and other key descriptor fields.
- Energy Tear Sheet: Provides a one-page tear sheet with corporate, market and financial highlights.
- FERC Form 1 Fin. And Op. Details Peer Comparison: Replicates all the major schedules of the FERC Form 1 and allows for the comparison of up to five filers for benchmarking performance.
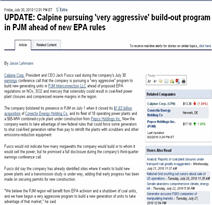
SNL Energy’s industry leading news coverage is tightly integrated with the company and power plant briefing books. From the stories, users can link directly into the various briefing books as well as other related stories on the same companies and/or plants. Market-moving news is delivered online, dynamically filtered to your specific interests.

