Home > IR Solutions > Stock Charting
Stock Charting
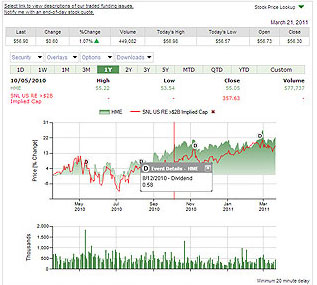
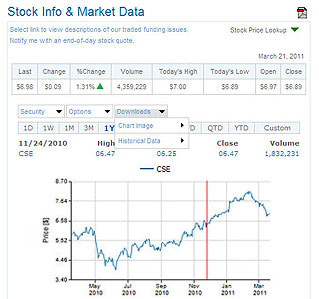
An SNL advantage has always been interactive graphing capabilities. Now we offer even more graphs, for both internal client use and for analysis by investors.
SNL graphs and charts provide:
- Customized look and feel to match your corporate branding
- Detailed hover-over historical pricing data
- Highly customizable and interactive options
- Select pre-set periods or a customized date range
- Add comparison indexes and peers
- Plot dividends and stock splits
- Track press releases and filings, all of which are hyperlinked to the actual documents
- Chart performance indicators such as total return and dividend yield percentages
- Export chart data in Excel format
- Download chart images
In addition to all the charting features, SNL also provides you with proprietary pricing ratios for display, which are updated dynamically from our database.


