TV Networks Data
 TV networks are launching, merging and rebranding.
They're chasing new revenue streams: online, VOD, original programming. What's the
financial impact of all this change? Where's it all leading? Who will come out ahead?
225+ cable networks. Premium channels. Broadcast networks. Regional
sports networks.
There's only one place to find everything you need to know about television networks:
cable, broadcast, premium and regional sports (RSN). SNL Kagan. We integrate expert
analysis, breaking news and comprehensive data into an online platform that's easy
to access anywhere, anytime.
Track how each network is performing against key benchmarks. Get insights on the future of advertising, including the latest figures on how new advertising models are doing. Know why ad revenue is up at some networks despite the decline of the :30 spot.
Proprietary data, compiled from the bottom up.
SNL Kagan provides financial and operational information and exclusive insight that
isn't available from any other source. Generated by the same industry experts the
networks themselves trust for custom valuations, business plans and M&A deal
appraisal.
Developed over the course of more than 40 years, SNL Kagan's unique process for compiling TV networks data includes surveys, interviews with top management and involvement at key industry events. SNL Kagan combines intelligence from each individual network and builds aggregated data from the bottom up.


SNL Kagan's market-leading annual analysis, Economics of Basic Cable Networks, has always been the most comprehensive network-by-network analysis of the cable programming industry in the U.S.
Through our online platform, you can access:
- Current and archived editions of the Economics of Basic Cable Networks analysis in PDF and spreadsheet form, which covers more than 180 TV networks in detail and with an eye to the broader network industry
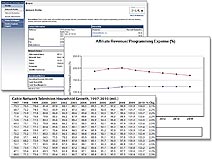
- Interactive, online network profiles with 5-year projections of affiliate fees, subscribers, cash flow and more on over 225+ basic, broadcast, premium and regional sports networks, constantly updated throughout the year
We've made our TV networks data easier to access and analyze through our online, interactive TV Network Profiles. For each of our covered 225+ basic, premium, broadcast and regional sports networks, our online platform gives you immediate access to a single network's:
- 5-year projections of financial and operational data including affiliate fees, subscriber counts, cash flow margins and more
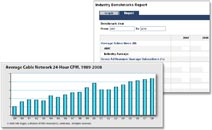
- Benchmarked position versus industry aggregates in tabular and graphical formats
- Ownership, corporate and management data
- Related news articles and analyses
You will also have access to a number of reporting tools that allow for instant cross-network analysis of all of our covered networks, across all available metrics and periods, all exportable to Excel or PDF for further analysis or presentation.
We go beyond offering detailed data, news and analysis of our 225+ covered basic, broadcast, premium and regional sports networks to provide industry benchmarks on each segment of the TV networks industry. Our historical and 5-year projected industry aggregates are bottom-up calculations of more than 20 key metrics, like revenue/subscriber and cash flow margin.
The online reports and tables we provide allow you to evaluate how various segments of the market have and are expected to fare, and what that means when evaluated against projected performance of your particular networks of interest.
All of our network-level and industry metrics and projections are supplemented by consistent, daily reporting of breaking news and analysis through our online web platform. Our constant coverage of the networks sector ensures that you have a window into the ever-evolving state of the market through:
- Breaking news, contextualized by our analysts to related trends and economics
- In-depth reports and statistics
- Quick links to related companies, documents and articles


