Property Asset Data

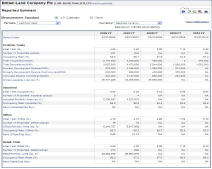
SNL tracks more than 84,000 properties around the world. Our property asset data gives you detailed information on a company's property portfolio, including property transactions, development pipeline, top tenants and top markets.
SNL puts financial, operational and asset-level details at your fingertips via links and menus that let you display data and drill down for further analysis with one click.
View purchase/sale terms, debt, occupancy, rents, demographics and other data essential to understanding how a property fits into a company's portfolio.
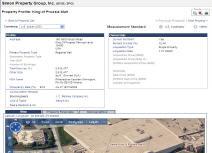
Use the individual property map to view road and aerial imagery as well as a 45° bird's-eye view of the property.


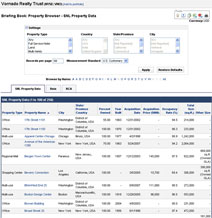
List of properties owned by a company, with filters to narrow down the list by Property Type, Country, State/Province and City.
In-depth detail of each property that SNL tracks. Includes purchase/sale terms, debt, occupancy, rents, tenants, demographics and other data essential to understanding how a property fits into a company's portfolio. Individual property maps provide basic road and aerial imagery as well as a 45° bird's-eye-view image of the property.
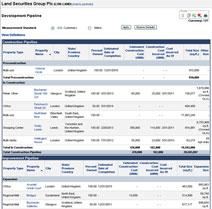
Details on properties in a company's development pipeline including Property Type, Location, Estimated Date of Completion, Estimated Construction Costs and Size.
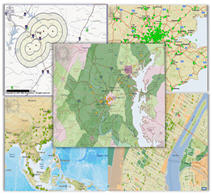
SNL Property Mapping makes mapping real estate properties and casinos against competitors and demographic data simple.
- View a company's property portfolio against its peers
- Utilize buffers, demographics and geographic layers in your analysis
- Add powerful visuals to your presentations
- Easily export your maps to PDF format
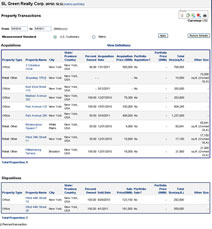
Company transaction history, with all of the properties a company has bought or sold over a custom time range, along with property assets and transaction details.
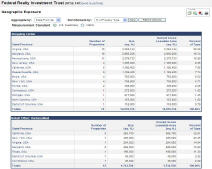
Property portfolio aggregated by City, MSA, State/Province, NCREIF Region, Country and Global Region. Includes the underlying individual property assets, along with year built, size, rent and occupancy.
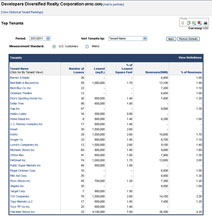
- Top Tenants: View tenants as reported by the company, or easily find all companies that have exposure to various tenants.
- Top Markets: Market breakout of a company's portfolio, as reported by the company, including Occupancy and NOI figures.

